
American Axle's (AXL) Q4 Earnings Trump Estimates, Down Y/Y
American Axle & Manufacturing Holdings, Inc. AXL reported mixed results for fourth-quarter 2019, wherein earnings topped the Zacks Consensus Estimate but revenues lagged the same. While the UAW-General Motors GM strike affected the company’s performance, better-than-expected EBITDA in the Driveline and Metal Forming segments led to the outperformance.
The Detroit-based global automotive parts supplier posted adjusted earnings of 13 cents per share, topping the Zacks Consensus Estimate of 1 cent. The bottom-line figure, however, slumped 71.1%, year on year. The company reported revenues of $1,430 million, missing the Zacks Consensus Estimate of $1,492 million. The revenue number also came in lower than the year-ago figure of $1,694 million.
American Axle & Manufacturing Holdings, Inc. Price, Consensus and EPS Surprise
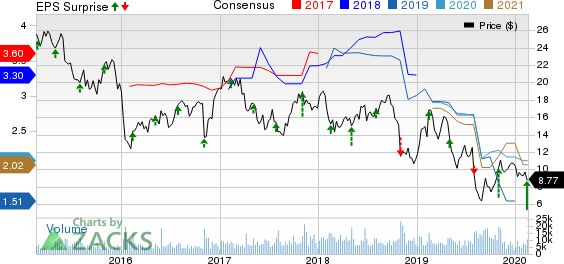
American Axle & Manufacturing Holdings, Inc. price-consensus-eps-surprise-chart | American Axle & Manufacturing Holdings, Inc. Quote
Segmental Highlights
The firm’s Driveline segment recorded sales of $1,015.6 million, down 13.4% year over year. Negative impact of the 40-day strike of its largest customer GM, a choppy metal market and unfavorable foreign-currency translation resulted in this decline. The unit EBITDA also declined 23.7% from the prior-year quarter to $124.9 million. However, the figure surpassed the Zacks Consensus Estimate of $123 million.
The company’s Metal Forming business generated revenues of $401.2 million, lower than the year-ago figure of $464.3 million. Its EBITDA also decreased $7.6 million year on year to $66.2 million. However, it beat the Zacks Consensus Estimate of $54 million. While lower North American and European production volumes marred the unit’s performance, improved launch and operating performance offset the losses.
The Casting unit posted revenues of $127.5 million, significantly lower than the year-ago level of $184.2 million. The segment EBITDA also declined to $2.4 million from the $6.4 million recorded in fourth-quarter 2018. It also missed the Zacks Consensus Estimate of $12.8 million.
Costs & Financial Position
American Axle’s SG&A (selling, general & administrative) expenses were $90 million in fourth-quarter 2019 comparison with the $97.1 million incurred in the prior-year period.
For the three-month period ended Dec 31, 2019, the company’s adjusted free cash flow (FCF) was $116.5 million compared with the $142.4 million witnessed in the year-earlier period. Capital spending in the quarter came in at $95 million, down from the year-ago quarter’s $131.2 million.
As of Dec 31, 2019, American Axle had cash and cash equivalents of $532 million, and net long-term debt of $3,612.3 million, representing a debt-to-capital ratio of 78.8%.
2020 Outlook
For 2020, American Axle anticipates sales of $5.8-$6 billion. While adjusted EBITDA is expected in the $930-$960 million band, adjusted EBITDA margin is likely to be around 16% of sales. Adjusted FCF is projected at $300 million, which assumes capital spending of 5.5% of sales.
Zacks Rank & Stocks to Consider
American Axle currently carries a Zacks Rank of 3 (Hold).
Some better-ranked stocks in the Auto-Tires-Trucks sector include BRP Inc. DOOO and SPX Corporation SPXC, both carrying a Zacks Rank of 2 (Buy), at present. You can see the complete list of today’s Zacks #1 (Strong Buy) Rank stocks here.
BRP has a projected earnings growth rate of 20.17% for 2020. Its shares have surged 99.7% over the past year.
SPX has an expected earnings growth rate of 6.52% for the current year. The stock has rallied 39.4% in the past year.
Today's Best Stocks from Zacks
Would you like to see the updated picks from our best market-beating strategies? From 2017 through 2019, while the S&P 500 gained and impressive +53.6%, five of our strategies returned +65.8%, +97.1%, +118.0%, +175.7% and even +186.7%.
This outperformance has not just been a recent phenomenon. From 2000 – 2019, while the S&P averaged +6.0% per year, our top strategies averaged up to +54.7% per year.
See their latest picks free >>
Want the latest recommendations from Zacks Investment Research? Today, you can download 7 Best Stocks for the Next 30 Days. Click to get this free report
American Axle & Manufacturing Holdings, Inc. (AXL) : Free Stock Analysis Report
General Motors Company (GM) : Free Stock Analysis Report
SPX Corporation (SPXC) : Free Stock Analysis Report
BRP Inc. (DOOO) : Free Stock Analysis Report
To read this article on Zacks.com click here.
Zacks Investment Research
