
AUD/USD Forex Technical Analysis – Strengthens Over .7158, Weakens Under .7132
The Australian Dollar finished higher on Friday, underpinned by demand for higher risk assets as investors continued to monitor the progress in U.S. stimulus talks, hoping for a new deal by the November 3 presidential election.
In other news, the start of the fourth quarter saw the recovery of the Australian economy strengthened as business activity picked up solidly amid a further loosening of social distancing curbs, notably in the services sector.
On Friday, the AUD/USD settled at .7136, up 0.0019 or +0.27%.
Despite the strength in the Aussie the last three days, buyers remained cautious ahead of the November 3 Reserve Bank of Australia (RBA) policy meeting with analysts calling for a rate cut from 0.25% to 0.10%. Policymakers are also looking for the announcement of more aggressive bond-buying as the economy still recovers from the damage caused by the pandemic.
Daily Swing Chart Technical Analysis
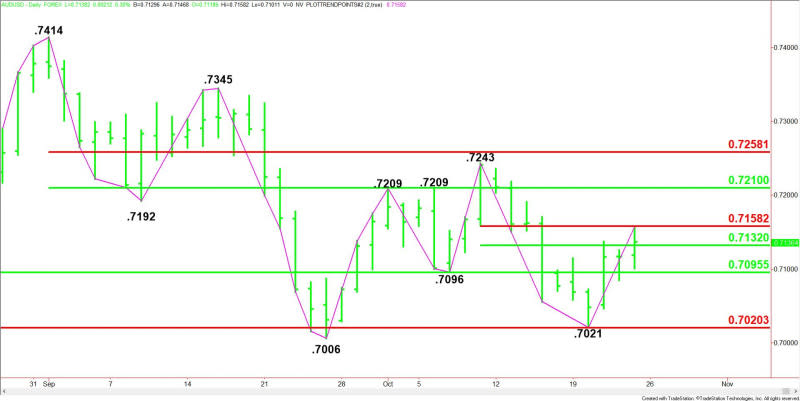
The main trend is down according to the daily swing chart. A trade through .7243 will change the main trend to up. A move through .7021 will signal a resumption of the downtrend.
The major support is the longer-term retracement zone at .7095 to .7020. This zone stopped the selling at .7021 on October 20.
The minor range is .7243 to .7021. The AUD/USD is currently testing its retracement zone at .7132 to .7158. This zone is controlling the near-term direction. Aggressive counter-trend buyers are going to try to drive the Forex pair through this zone, while sellers are going to try to form a secondary lower top.
The short-term range is .7414 to .7006. If the short-covering rally continues then look for the rally to possibly extend into its retracement zone at .7210 to .7258.
Short-Term Outlook
Friday’s price action suggests the near-term direction of the AUD/USD will be determined by trader reaction to .7132 to .7158.
Bullish Scenario
A sustained move over .7158 will indicate the presence of counter-trend buyers. The daily chart indicates that this move could trigger an acceleration to the upside with .7210 the next likely upside target.
Bearish Scenario
A sustained move under .7132 will signal the return of sellers. This could trigger a retest of .7095 to .7020.
For a look at all of today’s economic events, check out our economic calendar.
This article was originally posted on FX Empire
More From FXEMPIRE:
The Week Ahead – Brexit, U.S Politics, COVID-19, and a Busy Economic Calendar in Focus
Natural Gas Weekly Price Forecast – Natural Gas Markets Shoot Straight Up
Gold Weekly Price Forecast – Gold Markets Form Bearish Weekly Candle
Silver Weekly Price Forecast – Silver Markets Form Bears Candle
U.S. Dollar Index (DX) Futures Technical Analysis – Trader Reaction to Pivot at 93.275 Sets the Tone

