
CBRE Group's (CBRE) Q4 Earnings Miss, Revenues Top Estimates
CBRE Group Inc. CBRE reported fourth-quarter 2019 adjusted earnings per share of $1.32 cents, missing the Zacks Consensus Estimate of $1.34. However, the figure increased 8.8% year over year.
Though results reflect strong property sales and occupier outsourcing growth, decline in leasing activity and lower contributions from Real Estate Investments segment acted as dampeners.
The company generated revenues of $7.1 billion, outpacing the Zacks Consensus Estimate of $6.97 billion. The revenue figure also compares favorably with the year-ago quarter’s $6.3 billion. Moreover, fee revenues were up 7.9% (8.7% in local currency), year on year, to $3.7 billion. Adjusted EBITDA increased 5.5% (6.3% local currency) to $691 million.
For full-year 2019, the company reported adjusted earnings per share of $3.71, up 13.2% year on year. It marked the 10th consecutive year of double-digit adjusted earnings per share growth. Revenues for the year came in at $23.9 billion, up 12% from the prior year.
Quarter in Detail
The company’s Advisory Services segment registered year-over-year revenue growth of 3.4% (4.3% local currency) to $2.8 billion. Fee revenues increased 2.8% (3.6% local currency) to $2.5 billion.
The upswing was driven by global property sales, which jumped 21% (22% local currency), and reached its highest level ever for a quarter, indicating solid capital flows to commercial real estate.
However, commercial mortgage origination revenues were down 15% (same local currency). Global capital market revenues, which comprise property sales and commercial mortgage origination, were up 13% (14% local currency).
Advisory leasing revenues fell 7% (6% local currency). Although leasing revenues for the period emerged as the second highest ever for the company, the decline indicates a challenging comparison, year on year, as leasing revenues grew significantly in the year-ago period.
Valuation revenue rose 8% (10% local currency). In addition, property management and advisory project management revenues and fee revenues climbed 8% (10% local currency) and 8% (9% local currency), respectively.
Furthermore, Global Workplace Solutions segment registered an increase of 18.6% (19.4% local currency) in revenues to $4.06 billion. Fee revenues increased 13.4% (14.1% local currency) to $877 million. Performance was particularly strong in the Americas, Asia Pacific and the U.K. Solid revenue growth and cost discipline helped drive margin improvement across facilities management, project management and transaction services. Occupier demand for multiple services was solid and the new business pipeline remains strong.
The Real Estate Investments segment recorded 62.7% (63.7% local currency) growth in revenues to $247 million. However, adjusted EBITDA slid 18.2% (16.9% local currency). This decline reflects some large asset sales in the development and investment management businesses shifting from fourth-quarter 2019 to early 2020.
At year-end 2019, assets under management (AUM) reached a record high of $112.9 billion, marking an increase of $6.7 billion ($4 billion in local currency) from the prior quarter, reflecting decent capital raising, gains in asset values and favorable foreign-currency movement.
In-process development portfolio increased to $13 billion, up $2.1 billion from third-quarter 2019. There was a $2.3-billion increase in the pipeline during the fourth quarter to $5.8 billion. This indicates Telford contributions, fee development and built-to-suit projects.
Liquidity
CBRE Group exited fourth-quarter 2019 with cash and cash equivalents of around $971.8 million, up from $777.2 million as of Dec 31, 2018. As of Dec 31, 2019, the company had $3.7 billion of total liquidity. This comprised $901 million in cash in addition to the ability to borrow a total of $2.8 billion under its revolving credit facilities, net of any outstanding letters of credit. The company’s net leverage ratio was 0.42x as of the same date.
During the December-end quarter, the company repurchased a total of 1 million shares of its common stock for $51 million at an average price of $50.85 per share. Currently, the company has $400 million of stock-repurchase capacity.
Outlook
CBRE Group projects 2020 adjusted earnings per share at $4.05-$4.25. This indicates an increase of 12% year on year at the mid-point. Growth is anticipated to be stronger in the second half of the year. The Zacks Consensus Estimate for the same is currently pinned at $4.12.
CBRE Group, Inc. Price, Consensus and EPS Surprise
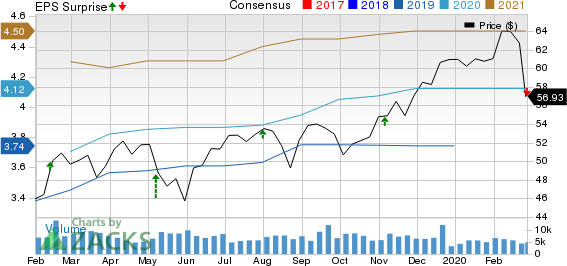
CBRE Group, Inc. price-consensus-eps-surprise-chart | CBRE Group, Inc. Quote
Currently, CBRE Group carries a Zacks Rank #3 (Hold). You can see the complete list of today’s Zacks #1 Rank (Strong Buy) stocks here.
Stocks That Warrant a Look
Colliers International Group Inc. CIGI currently carries a Zacks Rank of 2. The company’s earnings per share estimate for 2020 has been revised 7% upward to $5.33 in a month’s time. The stock has rallied 31.7% in six months’ time.
Jones Lang LaSalle Incorporated’s JLL Zacks Consensus Estimate for the current-year earnings per share climbed 2% to $13.93 over the past month. Shares of this Zacks #2 Ranked company have gained 9.3% over the past six months.
LGI Homes, Inc. LGIH also carries a Zacks Rank of 2, currently. The company’s ongoing-year earnings per share estimate moved 2.6% north to $7.86 in two months’ time. The stock has rallied 31.2% in the past year.
Today's Best Stocks from Zacks
Would you like to see the updated picks from our best market-beating strategies? From 2017 through 2019, while the S&P 500 gained and impressive +53.6%, five of our strategies returned +65.8%, +97.1%, +118.0%, +175.7% and even +186.7%.
This outperformance has not just been a recent phenomenon. From 2000 – 2019, while the S&P averaged +6.0% per year, our top strategies averaged up to +54.7% per year.
See their latest picks free >>
Want the latest recommendations from Zacks Investment Research? Today, you can download 7 Best Stocks for the Next 30 Days. Click to get this free report
Jones Lang LaSalle Incorporated (JLL) : Free Stock Analysis Report
Colliers International Group Inc. (CIGI) : Free Stock Analysis Report
LGI Homes, Inc. (LGIH) : Free Stock Analysis Report
CBRE Group, Inc. (CBRE) : Free Stock Analysis Report
To read this article on Zacks.com click here.
Zacks Investment Research
