
Crude Oil Price Update – Bears Defending $27.99 – $30.04 Retracement Zone
U.S. West Texas Intermediate crude oil futures are trading lower shortly before the regular session opening on Monday, but well-off its lows. The market opened sharply lower after a meeting between OPEC and its allies, initially scheduled for Monday, was delayed. The postponement stoked fears on Wall Street that a production cut might face hurdles.
At 10:25 GMT, May WTI crude oil futures are trading $27.18, down $1.15 or -4.02%. The low of the day is $25.28.
Crude oil clawed back most of those losses shortly after positive comments from Kirill Dmitriev, CEO of Russian sovereign wealth fund RDIF.
“I think the whole market understands that this deal is important and it will bring lots of stability, so much important stability to the market, and we are very close,” Kirill told CNBC’s “Capital Connection” on Monday.
Daily Technical Analysis
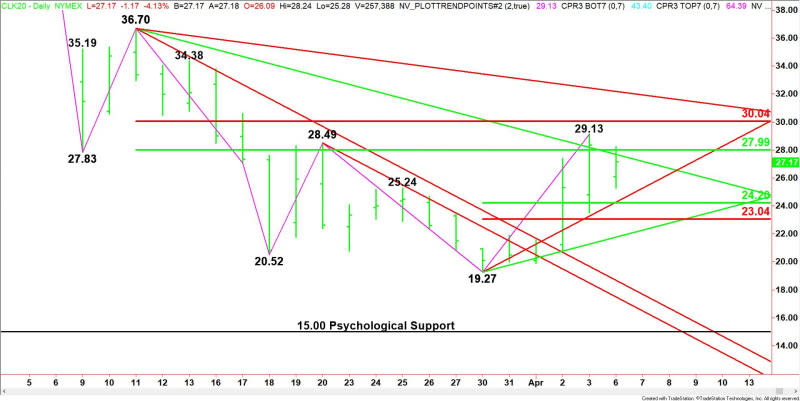
The main trend is down according to the daily swing chart. The trend turned up when buyers took out the previous main top at $28.49 on Friday.
A trade through $29.13 will indicate the buying is getting stronger. The main trend will change to down on a move through the last main bottom at $19.27.
The intermediate range is $36.70 to $19.27. Its retracement zone at $27.99 to $30.04 is the primary upside target. This zone stopped the rally at $29.13 on Friday. It’s also controlling the near-term direction of the market.
The short-term range is $19.27 to $29.13. Its retracement zone at $24.20 to $23.04 is the primary downside target and potential support area.
Daily Technical Forecast
Based on the early price action and the current price at $27.18, the direction of the May WTI crude oil market the rest of the session on Monday is likely to be determined by trader reaction to the downtrending Gann angle at $27.70 and the 50% level at $27.99.
Bullish Scenario
Overtaking $27.99 and sustaining the rally will indicate the presence of buyers. Taking out $29.13 will extend the uptrend. This could lead to a test of the Fibonacci level at $30.04.
A breakout over $30.04 could trigger an acceleration to the upside with the downtrending Gann angle at $32.20 the next target.
Bearish Scenario
A sustained move under $27.70 will signal the presence of sellers. If sellers return then this could trigger a steep break into a support cluster at $24.27 to $24.20. Watch for a technical bounce.
Side Notes
Since the main trend is up, buyers could come in on a pullback into $24.20 to $23.04. They are going to try to form a secondary higher bottom.
This article was originally posted on FX Empire

