

New Developments in China-Focused Indices, Stocks & Products
Bilateral China & Singapore trade increased 15% over the first 7M of 2018. In addition increased financial cooperation between the two countries has seen four milestone agreements conclude this week between financial regulators & financial institutions from both countries.
Last week SGX launched 5x leveraged single stock DLCs, that include DLCs on Tencent, Ping An, CNOOC & PetroChina. Following the first week of trading, Tencent DLCs were the most actively traded, with implied volatility of the underlying stock as high as 41% on 13 Nov.
In the 2018 YTD, the FTSE ST China Index generated less than half the losses of China’s CSI 300 & the FTSE China Small Cap Index. For the past three years, the FTSE ST China Index generated a 4% total return, compared to an 18% decline for the FTSE China Small Cap Index.
Singapore Exchange recently launched 5x leveraged single stock DLCs, that include DLCs on Tencent, Ping An, CNOOC & PetroChina. Following their first week of trading, Tencent DLCs were the most actively traded, with implied volatility of the underlying stock as high as 41% on 13 November.
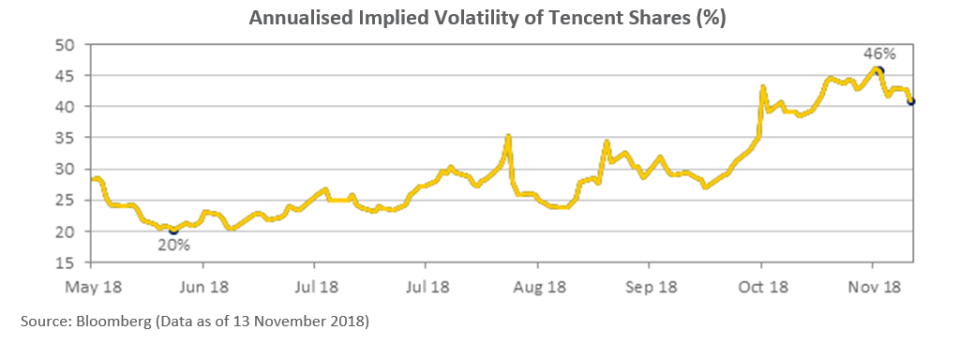
The surge in implied volatility, which has effectively doubled from 20% levels five months ago, has coincided with an increase in big internet-based technology stocks across the world. Looking back over the past two-three weeks alone, the price of the underlying Tencent shares have swung from an intraday low of HK$251.4 in the afternoon of 30 October, to an intraday high of HK$303.8 in the afternoon of 2 November. This saw the implied volatility of the stock surge to 46% as illustrated below.
The basic 5x DLC principle is simple – if the underlying asset moves by 1% from its closing price of the previous trading day, the value of a 5x DLC will move by 5% before cost and fees. With five times leverage on the daily performance of the underlying stock, the DLCs provide investors with the ability to make enhanced returns within a short period of time but also the risk of substantial losses if the underlying stock moves against the investor. For more information on the stock and the DLC products, which is categorised as a Specified Investment Product (“SIP”) click here.
Adding to the stock market volatility, there has also been a performance divide of approximately 30% between the S&P 500 Index and CSI 300 Index in the 2018 year thus far, with week-to-week data showing growth acceleration in the United States remains on track for 2018, whilst China, and most of Asia, expect deceleration in growth from 2017 levels.
Current Structural Reforms Focused on Private Sector & SMB
This morning China released its usual monthly ledger of industrial production, retail sales, property and ex-rural fixed assets investment, in addition to the surveyed unemployment rate. The October numbers saw industrial production and property and ex-rural fixed assets investment beat the consensus estimates, while retail sales came in below the 9.2% consensus, growing 8.6% YoY.
As reiterated by the People’s Bank of China (“PBC”) Governor Yi Gang on 14 October, China’s economy has continued to grow steadily in 2018, with progress achieved in structural upgrading and efficiency improvement (click here for full speech).
Preceding Monetary Policy Reports (click here) have PBC reiterating its role in the combined promotion of supply-side structural reforms and structural adjustments of credit policies. This is to “promote optimisation of the economic structure and upgrading of the industrial structure, transformation of the energy mix, financial inclusiveness, and the people’s livelihood, and to guide financial resources to key fields for economic and social development and to weak sectors so as to meet the effective financing needs of the real economy”.
From a policy perspective, increased assistance to non-state owned businesses and Small and Micro Businesses (“SMB”) remain a key priority. The aforementioned PBC reports have also maintained a combined step up in implementation of SMB policies, further improve the quality and efficiency of financial services provided to SMBs, and ensure that the objectives of expanding inputs and reducing costs of these financial services will be achieved.
It is generally recognised that SMBs provide 80% of the jobs in China cities. The segment is thus a key segment for development particularly when China maintains four times the population of the US, and its GDP per Capita is just one-sixth of US GDP per capita. In addition, on any past timeframe for the month of October right through to last five years ending October, the FTSE China Small Cap Index has underperformed the FTSE China Large Cap Index and the FTSE China Mid Cap Index.
FTSE ST China Index Provides Competitive China Exposure
China is Singapore’s biggest trading partner. Bilateral trade value between the two countries value also increased 15% over the first seven months of 2018. From a stock market perspective, the China market is much bigger with between 1000 to 1500 stocks with billionaire market capitalisation in SGD terms, compared to approximately 100 stocks in Singapore (click here for more).
Moreover, Singapore lists more than 200 stocks that report between one-tenth to all of their revenue to Mainland China. The FTSE ST China Index consists of SGX-listed stocks of the FTSE ST All-Share Index that have reported either at least 50% of their revenues from China, or reported at least 50% of their operating assets are located in China.
In the 2018 year to 13 November, the FTSE ST China Index has generated less than half of the losses of China’s CSI 300 and the FTSE China Small Cap Index. For the past three years, the FTSE ST China Index generated a 3.5% total return compared to an 18.1% decline in total return for the FTSE China Small Cap Index. Some recent highlights include:
The FTSE ST China Index includes eight stocks with market capitalisation of S$1 billion above including four STI constituents – Wilmar International, Hongkong Land Holdings, Yangzijiang Shipbuilding and Hutchison Port Holdings Trust;
The fifth largest capitalised stock of the Index is Yanlord Land Group which reported its 3QFY18 results last night, and highlighted its 64% jump in earnings per share for its 9MFY18 – the full report can be read here;
The three strongest performing stocks of the FTSE ST China Index in the year to date, by total return were Delong Holdings (+165%.0), China Sunsine Chemical Holdings (+31.0%) and Wilmar International (+7.0%).
Hi-P International was the least performing stock of the Index in the 2018 year-to-date which has declined 54.4% in total return in the 2018 year to date, following its 326.5% total return in 2017; and
These comparative performances compared to the non-weighted average performance of the Index constituents at a decline of 5.1% in total return for the 2018 year-to-date.
Over the past 10 years, China policymakers have moved from a high speed growth focus to a high quality growth focus. Of the current FTSE ST China Index constituents that have been listed for the 10 year period, the strongest performing three stocks spanned the Technology, Health and Raw Material Sectors.
These three stocks, Valuetronics Holdings, TZXP and China Sunsine Chemical Holdings, averaged 28.8% annualised total returns over the 10 years. The three least performing stocks of the Index averaged a 6.3% annualised decline in total return, while the 16 constituents listed for the duration averaged 11.0% annualised total returns for the 10 years.
Strategic Cooperation Agreement on CFETS-BOC Bond Indices
Bank of China Limited (“BOC”), China Foreign Exchange Trade System (“CFETS”) also known as the National Interbank Funding Center and SGX have announced the signing of a strategic cooperation agreement to jointly promote the CFETS-BOC Traded Bond Index and its sub-indices, outside of China to international investors, as well as to explore the feasibility of developing products based on the Bond Indices. CFETS is a sub-institution directly affiliated to the People’s Bank of China (PBC).
As discussed in the Monetary Authority of Singapore (“MAS”) media release:
The Bond Indices, designed by CFETS and BOC, track the movements of the Chinese bond market and can be used by investors to benchmark their Chinese bond portfolio performance.
SGX will be the first exchange to distribute the CFETS-BOC Traded Bond Indices outside of China.
The launch of the Bond Indices can catalyse the development of tradable China bond products and facilitate greater investments into China’s bond market by international investors.
As highlighted by the media release (click here) 2018 has been a landmark year for financial cooperation between China and Singapore – seeing four milestone agreements concluded this week between financial regulators and between financial institutions from both countries.

