
E-mini Dow Jones Industrial Average (YM) Futures Technical Analysis – Upside Target Zone 28884 – 28996
March E-mini Dow Jones Industrial Average futures are trading higher on Tuesday shortly after the cash market opening as investors attempt to regain yesterday’s steep losses. On Monday, stocks suffered its worst day in nearly four months on fears that a coronavirus outbreak could hit global economic growth.
Markets across the world stabilized as the head of the World Health Organization (WHO) said he was confident in China’s ability to contain the virus outbreak, which has killed 106 people, prompted businesses to close operations and curbed travel.
At 16:14 GMT, March E-mini Dow Jones Industrial Average futures are trading 28695, up 214 or +0.75%.
Investors will keep a close watch on Apple Inc. results, due after markets close amid concerns of a disruption in iPhone production as the coronavirus spreads across major markets like China.
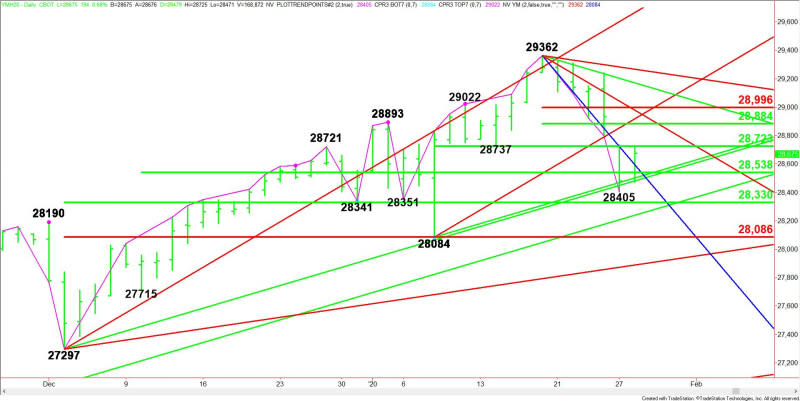
Daily Technical Analysis
The main trend is up according to the daily swing chart, however, momentum is trending lower. The main trend will change to down on a move through 28084. A move through 29362 will signal a resumption of the uptrend.
The minor trend is down. This is generating the downside momentum.
The main range is 27297 to 29362. Its retracement zone at 28330 to 28086 is major support and a value zone.
The first minor range is 27715 to 29362. Its 50% level at 28538 is potential support.
The short-term range is 28084 to 29362. Its 50% level at 28723 is acting like resistance today.
The second minor range is 29362 to 28405. Its retracement zone at 28884 to 28996 is a potential upside target.
Daily Technical Forecast
Based on the early price action, the direction of the March E-mini Dow Jones Industrial Average the rest of the session on Tuesday is likely to be determined by trader reaction to the 50% level at 28723.
Bullish Scenario
A sustained move over 28723 will indicate the presence of buyers. This could trigger an acceleration to the upside with the next target zone 28884 to 28996. A pair of Gann angles at 28916 and 28978 are also potential resistance. Look for sellers on the first test of this area.
Bearish Scenario
A sustained move under 28723 will signal the presence of sellers. This could trigger a break into a series of potential support levels including 28594, 28538, 28500 and 28481.
This article was originally posted on FX Empire
More From FXEMPIRE:
Gold Price Forecast – Prices Declining, Just a Pre-Fed Fake Out
Natural Gas Price Prediction – Prices Rise as Weather Forecast Turns Colder
GBP/JPY Price Forecast – British Pound Falls Against Japanese Yen
Gold Price Prediction – Prices Slip as Dollar Rises and Riskier Assets Gain Traction
AUD/USD Price Forecast – Australian Dollar Falls But Find Value Hunters
