
E-mini S&P 500 Index (ES) Futures Technical Analysis – Reaction to 3231.25 Sets Tone into Close
December E-mini S&P 500 Index futures are edging higher late in the session on Thursday, led by a bounce in shares of Amazon.com and Apple, while uncertainty over more U.S. fiscal stimulus kept trading most issues muted.
Prices retreated early in the session as a surprise rise in weekly jobless claims signaled a slowdown in economic growth, but the move attracted enough buyers to turn the market higher with investors returning to the perceived safety of technology-related stocks.
At 18:40 GMT, December E-mini S&P 500 Index futures are trading 3249.75, up 18.50 or +0.57%.
Nine of the 11 major S&P 500 indexes were trading higher, with information technology leading gains. The S&P 500 briefly fell 10% below its intraday record high hit on September 2. If the benchmark index closes at that level, it will enter correction territory.
Daily Swing Chart Technical Analysis
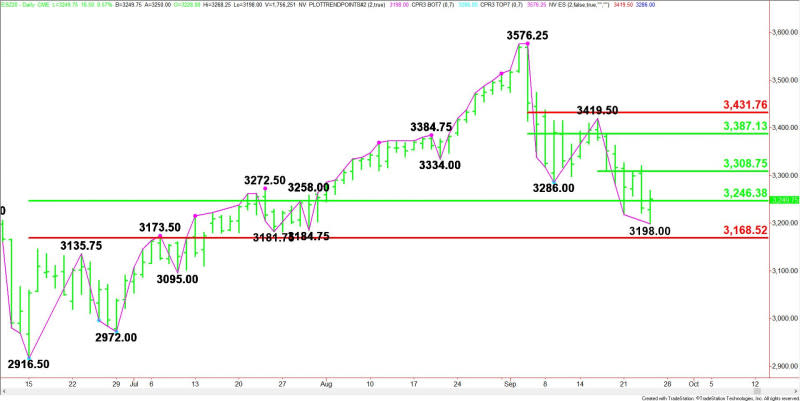
The main trend is down according to the daily swing chart, but there are signs that momentum may be getting ready to shift to the upside.
A trade through the intraday low at 3198.00 will signal a resumption of the downtrend. The main trend will change to up when buyers take out 3419.50. This is unlikely, however, the market is currently in a position to post a potentially bullish closing price reversal bottom. The chart pattern won’t change the trend to up, but if confirmed, it could trigger the start of a 2 to 3 day counter-trend rally.
The main range is 2916.50 to 3576.25. The index is currently testing its retracement zone at 3246.25 to 3168.50. This zone is likely to control the near-term direction of the index. Trader reaction to this zone will set the tone into the close.
The minor range is 3419.50 to 3198.00. Its 50% level or pivot at 3308.75 is the first potential upside target.
Short-Term Outlook
Based on the early price action, the direction of the December E-mini S&P 500 Index into the close will be determined by trader reaction to Wednesday’s close at 3231.25.
Bullish Scenario
A sustained move over 3231.25 will indicate the presence of buyers. Overcoming the main 50% level at 3246.50 will indicate the buying is getting stronger. If this creates enough late session momentum, we could see a test of the minor pivot at 3308.75.
Bearish Scenario
A sustained move under 3231.25 will signal the presence of sellers. This could lead to a retest of the intraday low at 3198.00, followed by a pair of main bottoms at 3184.75 and 3181.75 and the main Fibonacci level at 3168.50.
For a look at all of today’s economic events, check out our economic calendar.
This article was originally posted on FX Empire

