

Ernest Lim: STI Sees Limited Downside In Near-Term
Dear all,
Our STI has broken a one-month trading range of around 3,288 – 3,348. Where will STI and the other indices go from here?
US’s S&P500
Based on Chart 1 below, although 20D exponential moving average (EMA) is trending lower, the other EMAs, namely 50D, 100D and 200D EMA are still trending up. RSI closed at 37.2. Since 7 November 2016, the lowest RSI was around 35.9 on 10 April 2017. Although the directional indicators (DIs) are negatively placed, ADX is still at a low 12.2 which is indicative of a trendless market. My personal view is S&P500 should find good supports around 2,404 – 2,419, coupled with the relatively low RSI. A sustained break below 2,404 (albeit very unlikely in the near term) negates S&P500’s (tad) bullish chart.
Near term supports: 2,416 – 2,419 / 2,404 / 2,393 – 2,395
Near term resistances: 2,437 / 2,446 – 2,450 / 2,457
Chart 1: S&P500’s RSI At 2nd lowest level since 7 November 2016
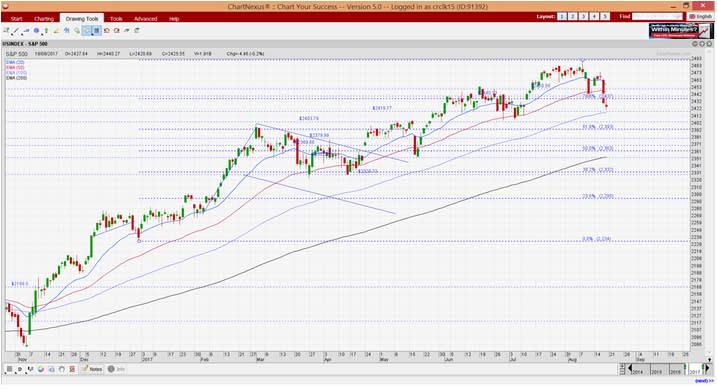
Source: Chartnexus chart as of 18 August 2017
Hong Kong’s Hang Seng
Hang Seng’s chart continues to be on an uptrend with no bearish divergences seen on MACD, OBV and RSI. Notwithstanding 20D EMA which seems to be trading sideways, the other EMAs are still rising. ADX closed 34 on last Friday amid positively placed DIs. With reference to Chart 2 below, Hang Seng continues to be on an uptrend. A sustained close below 26,150 negates Hang Seng’s (still relatively) bullish chart outlook.
Near term supports: 26,854 / 26,500 – 26,610 / 26,255
Near term resistances: 27,168 / 27,623 / 27,870
Chart 2: Hang Seng Remains On Uptrend
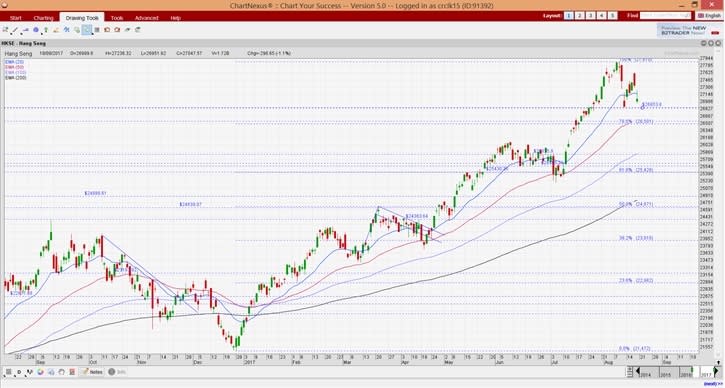
Source: Chartnexus chart as of 18 August 2017
STI last closed 3,252
STI seems weaker than S&P500 and Hang Seng on a relative basis. Based on Chart 3 below, 20D EMA is turning down. The break below 3,288 points to an eventual measured technical target of around 3,228. Although 20D EMA is turning down, it is noteworthy that 50D, 100D and 200D EMA are still rising with a good degree of separation. RSI closed at 39.7 on last Friday which was the lowest seen since 10 November 2016. My personal view is that STI should find good supports around 3,228 – 3,236 and is unlikely to make a sustained close below 3,228 in the near term.
Near term supports: 3,250 / 3,236 / 3,228 – 3,230
Near term resistances: 3,276 / 3,290 / 3,297
Chart 3: STI’s RSI Lowest Since 10 November 2016

Source: Chartnexus chart as of 18 Aug 2017
Conclusion
Based on the above charts, it is likely that S&P500 and STI may have limited near term potential downside, should their supports hold. Personally, I have bought in some more shares in certain companies on weakness for the past two weeks, given their near-term potential catalysts seem to remain intact.
Readers who wish to be notified of my write-ups and / or informative emails, can consider signing up at http://ernest15percent.com. However, this reader’s mailing list has a one or two-day lag time as I will (naturally) send information (more information, more emails with more details) to my clients first. For readers who wish to enquire on being my client, they can consider to leave their contacts here http://ernest15percent.com/index.php/about-me/
P.S: Do note that as I am a full time remisier, I can change my equity allocation fast to capitalize on the markets’ movements.
Disclaimer
Please refer to the disclaimer HERE

