

Five Influential Stock Chart Patterns
In this monthly special technical analysis feature, CMC Markets will bring you trading guides and strategies to help you develop and enhance your trading skills.
Chart pattern analysis consists of a set of pre-defined patterns formed by moving market prices. Chart patterns are used by traders and analysts to identify potential entry and exit points in the markets.
A part of technical analysis, chart pattern analysis can help traders to predict the future direction of the markets and spot potential trend reversals based on historical price data. Common chart patterns include triangles, double tops and bottoms, head and shoulders, flags, pennants and wedges. Some traders look at price charts to complement their fundamental research on what to buy and when, while others make decisions based solely on what the charts are telling them.
In this article, we take a look at five influential stock chart patterns that can be a powerful addition to your strategy, no matter which approach you take to trading the markets.
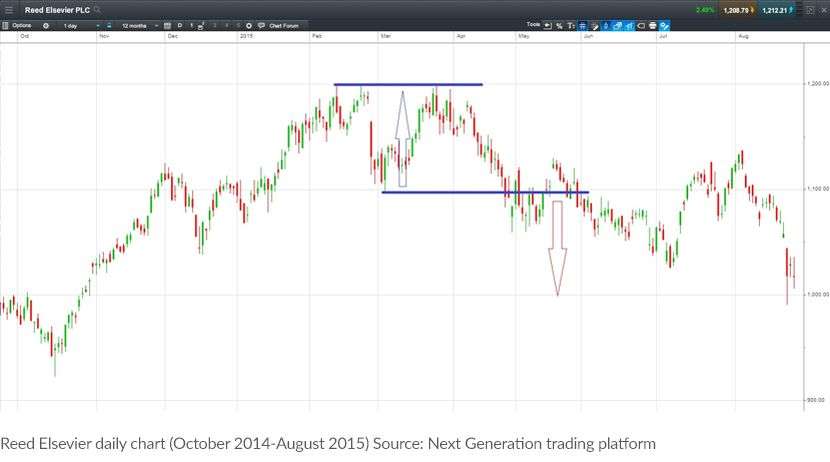
Double top chart pattern
The double top is a simple yet effective chart pattern that most commonly indicates that an upward trend may be losing momentum. It occurs when a stock hits a price level but meets resistance and falls back down from it (see highlighted area in chart). When the price moves back up but fails to break the previous high, it forms the influential double top pattern. The double top pattern is considered complete when the price falls back and breaks the previous low, indicating further weakness. The target being the ‘height’ of the pattern projected down from where it breaks that low.
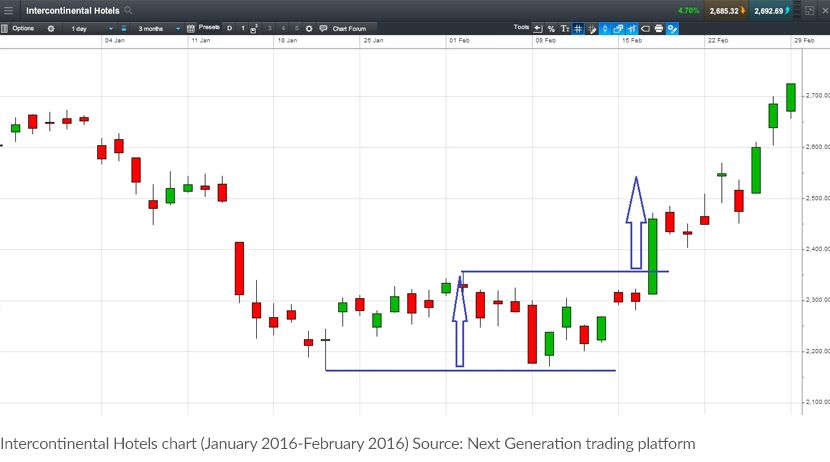
Double Bottom Chart
The double bottom is the opposite of a double top and applies to a falling market. In a double bottom, the falling price hits a low point and then bounces back up. The price turns lower again but doesn’t break through that previous low. It’s when the price rallies and pushes through the previous high that the double bottom is completed. The target can then be perceived as the height of that double bottom, projected from that breakout point (see the second arrow in accompanying chart).
Trendlines and Break Outs
Like the classic cliché, ‘the trend is your friend’, chart followers look to identify a trend in a particular stock and jump on board with the intention of riding that move further. But of course trends don’t last forever and a trendline break can be another influential stock pattern. Trendlines are drawn underneath rising lows in an uptrend (indicating buying demand) and above falling highs in a downtrend (indicating selling pressure). A break in this level, as indicated by the blue circle in the accompanying chart, is an indication that a change of trend could be on the cards, often prompting traders and investors to adjust their positions accordingly.

Head and Shoulders Pattern
The head and shoulders pattern is similar to a double top, but is made up of three highs (a peak, followed by a larger peak and then a small peak again, hence the name head and shoulders). Typically in a head and shoulders pattern, the second peak should be the largest, indicating the head, followed by a lower high in the third peak. The chartist will draw a smaller trendline under the recent lows, referred to as the ‘neckline’. It is when this trendline is broken and price moves lower that the head and shoulders pattern is said to be complete, and the target is for a move lower still – equal to the height of the ‘head’ in the pattern. Head and shoulders are reversal patterns that are used to indicate a possible change in sentiment from a bullish to a bearish market or vice versa.

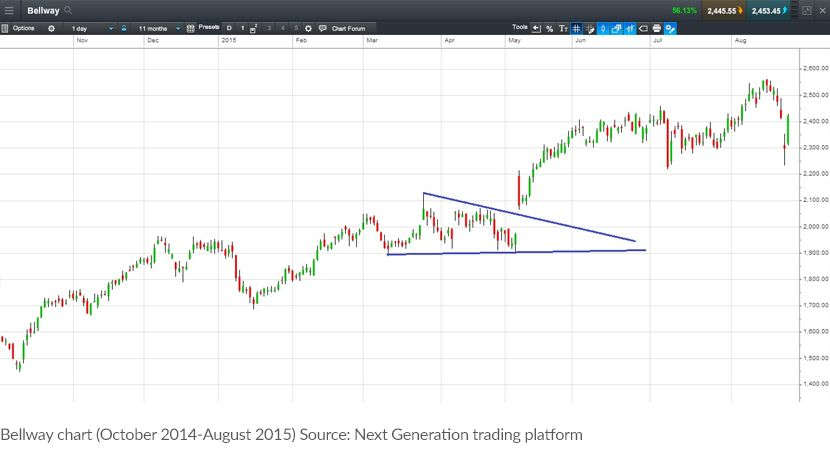
Triangle
Not all patterns suggest that the stock you are following is about to reverse direction. Some can signal that the market is just pausing, before continuing its original direction. One of the most common continuation patterns is the triangle. It gets its name because the stock trades in a tighter and tighter pattern, carving out the shape of a triangle on the chart. The assumption behind these patterns is that when it breaks, it will continue the direction of the prior trend. So in an uptrend, the triangle is expected to break upwards, giving a signal to buy, and vice versa if the stock was in a downtrend before the pattern formed.
Symmetrical triangle
Symmetrical patterns consist of at least two lower highs and two higher lows. If a trendline is drawn connecting the highs, and a separate trendline is drawn connecting the lows, the lines should have matching gradients Like a triangle, these lines get tighter and tighter until they converge and then continue to move in the same direction as before.
Ascending triangle
Ascending triangles are generally considered bullish and an indication that a previous uptrend will continue. In an ascending triangle, the top part of the trendline is flat, while the bottom trendline slopes upwards.
Descending triangle
Opposite to an ascending triangle, the descending triangle is a bearish formation and typically signals a continuation during a downtrend. Descending patterns can sometimes be found at the end of an uptrend and could signal a reversal in price.
Want to learn more about technical analysis and how to trade the markets? Join us at any of our free webinars or events to learn more today.

CMC Markets is an execution-only service provider. The material (whether or not it states any opinions) is for general information purposes only and does not take into account your personal circumstances or objectives. Nothing in this material is (or should be considered to be) financial, investment or other advice on which reliance should be placed. No opinion given in the material constitutes a recommendation by CMC Markets or the author that any particular investment, security, transaction or investment strategy is suitable for any specific person.
CMC Markets does not endorse or offer opinions on the trading strategies used by the author. Their trading strategies do not guarantee any return and CMC Markets shall not be held responsible for any loss that you may incur, either directly or indirectly, arising from any investment based on any information contained herein.
This article is brought to you by CMC Markets, an execution-only service provider. For further, round-the-clock market analysis, and to find out more about CMC Markets, visit www.cmcmarkets.com.sg.


