
Hothouse ETFs: Homebuilders
Some of last week’s headlines highlight the reasons: rising confidence in the space and positive surprises in home starts. Falling mortgage delinquencies and continuing low mortgage rates also help the outlook.
To be sure, the homebuilders industry has been ugly for the better part of five years. One can only hope that the latest promising signs amount to a recovery with legs.
The ETF landscape for this industry is narrow but deep. It’s narrow because only two funds cover the space, but deep because each fund boasts significant assets and real liquidity. This makes either choice viable from an accessibility standpoint.
The two ETFs are the iShares Dow Jones U.S. Home Construction Index Fund (ITB - News) and the SPDR S'P Homebuilders ETF (XHB - News).
Since the Oct. 3, 2011 nadir through May 17, 2012, ITB has outperformed XHB, returning 84.6 percent to XHB’s 68.6 percent. For reference, the SPDR S'P 500 ETF (SPY - News) returned 22.1 percent.
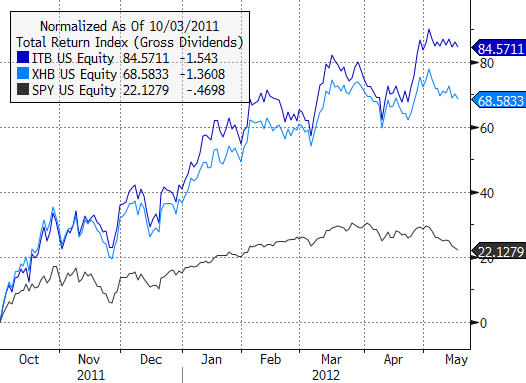
This wide performance difference makes sense:The two funds offer very different baskets of stocks.
XHB equal-weights its broad take on the industry while ITB weights its more-defined industry slice by market cap.
A peek at each fund’s top three holdings highlights these differences.
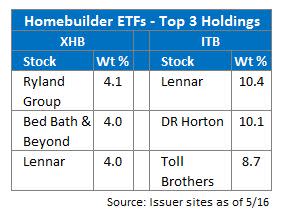
Bed, Bath ' Beyond—a retailer that doesn’t exactly leap to mind when you think homebuilders—lands at No. 2 in XHB’s portfolio.
Meanwhile, ITB holds hefty positions in building industry heavies like Toll Brothers, DR Horton and Lennar.
To be fair, ITB holds home-related retailers too, but its position in furniture seller Ethan Allen, for example, is less than 1 percent of the portfolio compared with about 4 percent for the equal-weighted XHB.
Still, the snapshot above reveals something important:Investors with strong views on the homebuilders industry might be disappointed to know that XHB has less than a third of its weight in bona fide homebuilders.
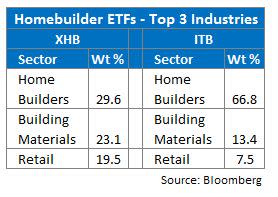
In my view, a homebuilders ETF seems like an odd place to want diversity, though XHB’s diffuse exposure probably provides a measure of protection in the worst of times.
Here’s a look at returns over the past five years, which highlights the dangers of more pure exposure when the roof falls in.

ITB lost 53.8 percent for the five-year period, while XHB lost “only” 33.6 percent.
ITB’s underperformance over the mostly down five-year period and its outperformance in its recent leg up sounds like high beta.
But when I regressed five-year net asset values for each fund on the broad market using SPY, the resulting poor fit makes it hard to talk about beta with any conviction.
The flip side is that the five-year correlations for each fund with the broad market are relatively low:0.76 for ITB and 0.80 for XHB.
That means that either of these funds delivers a bit of diversification benefit in a portfolio context—assuming the returns don’t clobber you first.
I think ITB is the better fund here. It delivers better exposure that’s well worth the 12 basis point fee differential in my view. ITB comes with an annual expense ratio of 0.47 percent vs. 0.35 percent for XHB.
The market will decide in the end, of course, but forgive me for rooting for both funds to do well.
Homebuilders have taken a pounding, and a continued leg up should mean more jobs with more paychecks and more consumer spending.
Permalink | ' Copyright 2012 IndexUniverse LLC. All rights reserved
More From IndexUniverse.com
