

SGX Research: Singapore Office REITs Began Month on Firm Ground
In the first half of March, REITs with majority income from Singapore office properties averaged a 2.1% gain, compared to a marginal 0.2% decline for the STI. SGX also lists multiple REITs that invest in international office properties.
Recent gains in Office REITs have been generated ahead of Wed Night which is expected to bring the first interest rate hike by the Fed Reserve in 2018. With rates increasing on stronger growth, positive impacts on office rental activity can balance impacts of higher borrowing costs.
CCT was the strongest of the Office REITs in the month thus far with a 4.6% total return. On 23 Jan, CCT reported FY17 distributable income rose 7.4%. CCT’s price has firmed 7.1% from 23 Feb with portfolio drivers including office rental recoveries & proactive capital management.
Last week the Straits times Index (“STI”) gained 0.8%, paring its March month-to-date decline to 0.2%. The five strongest STI stocks averaged a 4.4% gain, whilst the five least performing stocks averaged a 2.2% decline. After Venture Corporation, the next best performing STI stock last week was CapitaLand Commercial Trust (“CCT”) with a 5.2% gain.
Compared to the STI’s marginal decline in March (through to 16 March), the four REITs (CCT, Keppel REIT, Frasers Commercial Trust, OUE Commercial Trust) that maintain investments in Singapore office properties have averaged a 2.1% gain. This has also outperformed the S&P Asia Pacific REIT Index which gained 0.4%.
These comparative performances are illustrated below.

The recent gains in the Office REITs have been generated ahead of Wednesday night which is expected to bring the first interest rate hike by the Federal Reserve in 2018. The wide consensus is that the Federal Reserve will hike interest rates three times in 2018 with Fed Fund Futures currently pricing a 30% probability of a fourth rate hike before year end. Recent Federal Reserve Statements have made reference to economic activity rising at a solid rate with inflation below 2%. The positive impacts of financial and international business services growth, in addition to office rental activity can balance the impact of higher borrowing costs.
CCT
CCT is Singapore’s largest capitalised Office REIT and aims to own and invest in real estate and real estate-related assets which are predominantly used for commercial purposes. The total value of CCT’s deposited properties is approximately S$10.8 billion as at 31 December 2017 comprising a portfolio of 10 prime commercial properties in Singapore. In the first half of March the REIT posted a 4.6% total return. CCT has moved 7.1% higher from a closing price of S$1.690 on 23 February to a closing of S$1.810 on Friday.
Keppel REIT
Keppel REIT, the second largest capitalised of the Office REITs, in addition to an STI Reserve List constituent, has gained 2.6% in the first half of March. As of 31 December 2017, Keppel REIT had assets under management of approximately S$8.5 billion comprising interests in nine premium office assets (completed and under development) strategically located in Singapore’s CBD, as well as Australian capital cities of Sydney, Melbourne, Brisbane and Perth. For its FY17 Keppel REIT reported Singapore properties contributed 81.2% to its portfolio income, with Australia properties making up the 18.8% balance.
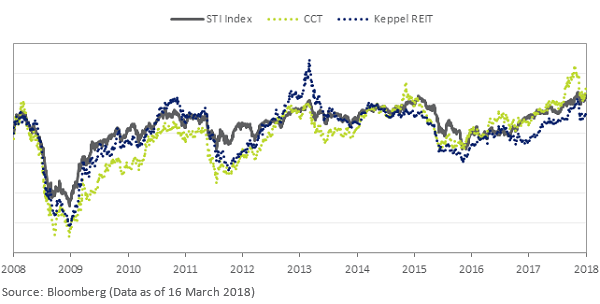
Past Correlation of CCT & Keppel REIT to the STI
CCT has been listed since 2005 and Keppel REIT has been listed since 2006. Over the past 10 years, day-to-day close prices of these two Office REITS have both been more correlated to the STI than the largest Retail, Industrial and Logistics REITs. The simple correlation coefficient for CCT to the STI over the 10 years was 0.913, and 0.911 for Keppel REIT.
While the directional correlation of the two REITs to the STI has been significant, as illustrated below, there were multiple instances when the two Office REITs would outpace the advances and declines of the STI. Amongst the multiple drivers, this can be mainly attributed to the cyclicality of Singapore’s office rental market.
The performance comparisons below do not include distributions over the 10 year period. Over the past 10 years CCT generated an annualised total return of 9.5%and Keppel REIT generated an annualised total return of 8.4%.
Daily Price Variations (March 2008 – March 2018)
CBRE’s Recent Office Rental Report
Both CCT and Keppel REIT cited the following CBRE statistics in their FY17 reports:
Singapore’s Core CBD and Grade A occupancy rates are at 93.8%.
For 4Q17 the Grade A occupancy rate recorded an uptick of 2.2% to 93.8% from 91.6% in 3Q17.
Similarly, Singapore’s core CBD office occupancy improved from 92.5% in 3Q17 to 93.8% in 4Q17, reported to be driven by higher commitment levels at both new and existing office developments.
The average monthly market rent for Grade A offices rose to S$9.40 psf in 4Q 2017, an YoY increase of 3.3% signalling a recovery in the office market. This was attributed to due to stronger leasing activity, mainly from tenants in the co‐working and technology sectors. For more details see here.
Singapore Focused Office REITs
There are seven REITs listed on SGX that are categorised by GICS® as Office REITs. Note this does not include REITS that have more diversified portfolios that can include Office properties, such as Mapletree Greater China Commercial Trust. Amongst the seven REITs, the four REITs that have office property investments in Singapore include CCT, Keppel REIT, Frasers Commercial Trust and OUE Commercial REIT.
Frasers Commercial Trust reported that for its 1QFY18 its net property income was evenly balanced between Singapore and Australia. OUE Commercial REIT reported that for its 4QFY17, Lippo Plaza in Huangpu Shanghai contributed 21% to its revenue.
To see more details of each REIT in SGX StockFacts, click on the REIT name.
Name | SGX Code | Market Cap S$M | 16 March Closing Price* | Month to Date Total Return % | Total Return YTD % | P/B (x) | Dvd Ind Yld % | Latest Financial Results |
C61U | 6,537 | 1.810 | 4.6 | -4.2 | 1.0 | 4.8 | ||
K71U | 4,101 | 1.210 | 2.5 | -2.9 | 0.9 | 4.7 | ||
BTOU | 1,269 | 0.930 | 2.2 | 4.1 | 1.1 | 6.2 | ||
ND8U | 1,250 | 1.420 | -0.7 | -2.6 | 0.9 | 6.8 | ||
TS0U | 1,104 | 0.715 | 2.1 | 2.5 | 0.8 | 6.5 | ||
CMOU | 729 | 0.880 | -1.7 | -4.2 | N/A | N/A | N/A | |
UD1U | 493 | 0.785 | 1.1 | 5.1 | 1.1 | 7.6 | ||
Average | 1.5 | -0.3 | 1.0 | 6.1 |
*SGD equivalents shown for Manulife US REIT and Keppel-KBS US REIT which are traded in USD. Source: Bloomberg & SGX StockFacts (Data as of 16 March 2018)
This article was originally published on SGX.
