

SI Research: Oil & Gas Industry Outlook
It has almost been three years and the oil market still seems awash with crude. Despite the Organisation of The Petroleum Exporting Countries’ (OPEC) best efforts, the 14-member body that controls more than 81.5 percent of world’s oil reserves and produces almost 50 percent of world production, has failed to help lift oil prices meaningfully.
Today, the West Texas Intermediate (WTI) crude oil price is just sitting barely above US$50 per barrel. How has the landscape of the industry changed? Will oil prices head higher?
Rising Rig Counts
Based on a three-year historical data, our research showed that rig counts share a strong positive correlation with oil price, with correlation coefficient of about 0.82. However, there is a time lag between the movement of rig counts and oil prices, especially during downtrends. Intuitively, this is because rig operators would try to stay afloat to cover as much fixed and sunken costs as possible.
According to data from Baker Hughes, worldwide rig counts (both onshore and offshore) that are in operation have been growing, since bottoming out in April 2016 at about 1405 rigs. In August 2017, worldwide rig counts have recovered more than 50 percent to 2116.
Rig Count And Oil Price
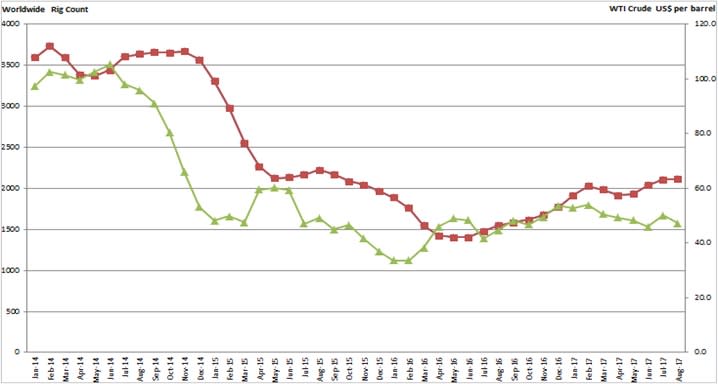
Source: Baker Hughes, Shares Investment
Regression Model: WTI Crude Oil Price Versus Rig Count
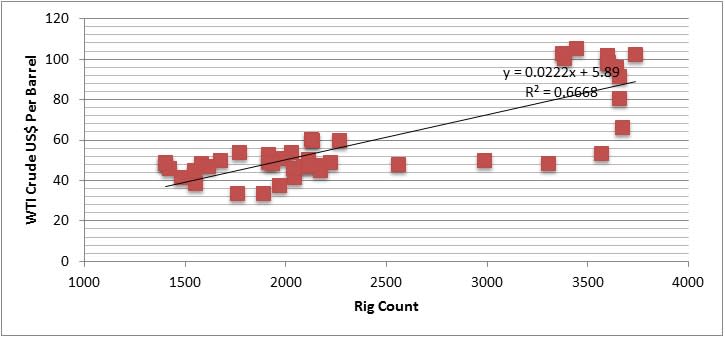
Source: Shares Investment
US Drillers Turning On Taps
Arguably US drillers may have won the US-OPEC oil war, which was ironically sparked off by Saudi Arabia – the de-facto leader of OPEC. Back then, Saudi-led OPEC decided to flood the oil market with crude in its bid to force out US shale producers.
At its peak, Middle East region had 422 operating rigs in December 2015 but that has fallen to 391 by August 2017. On the other hand, US drillers have been turning their taps back on as US rig counts continued to recover since hitting bottom at 408 in May 2016. By August 2017, US rig counts rose to 947.
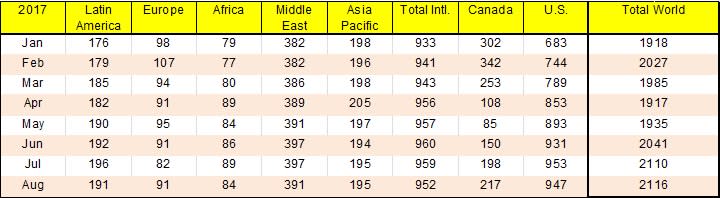
Source: Baker Hughes
This suggested that US shale industry may be more resilient and more adaptable than OPEC has thought. Further testament to that, the US is leading the growth of world crude oil (including shale oil) production in 2017 and is forecasted to grow 0.697million barrels per day. On the contrary, OPEC’s production is only projected to grow by 0.215 million barrels per day in 2017.
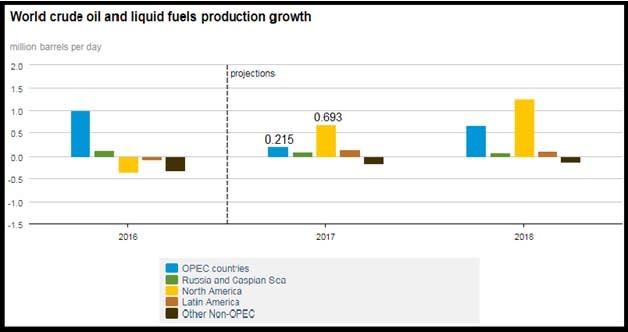
Source: EIA
US Inventories No Longer Stockpiling
The world typically use proxy from US inventories since the latter is the largest oil consumer of the world. On the bright side, growing demand has helped to curb US crude oil inventories from growing. In fact, the US has mostly been drawing down on inventories since April 2017.
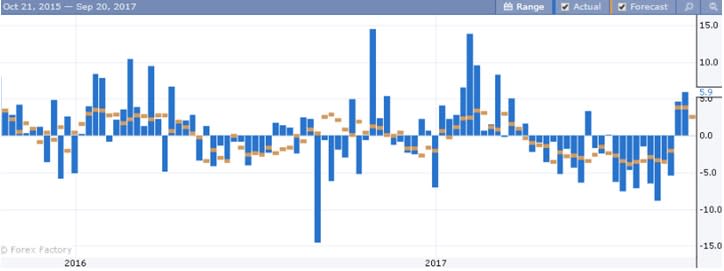
Source: Forex Factory, EIA (weekly)
However, US inventories remain high and the US is still sitting on a stockpile of 468.2 million barrels, in the upper half of the average range. That said, Energy Information Administration (EIA) expects US inventories to start building again in coming months due to the disruptions to oil refiners caused by Hurricane Harvey and Irma. As a result, US refinery operable utilisation dropped to 77.7 percent (as of 8 September) compared to 96.3 percent a month ago.
This may put a lid on oil prices in the short-term. However, gasoline and distillates inventories could see huge draw down amidst strong demand, which should help limit the negative impact on oil prices. In the meantime, disrupted refiners are also slowly coming back online.

Source: EIA
Wild Card
The oil market is seeing tighter demand-supply dynamics in most of 1H17 on the backdrop of stronger economic activities and production curbs amongst OPEC members and Russia. Oil prices are also being propped up by talks that OPEC and Russia would collectively hold back 1.8 million barrels per day of supply into 2018.
That said, upsides in oil prices could be capped, as US shale production continues to grow albeit the low oil price environment. In its monthly drilling productivity report, the EIA projected that shale production in US will grow by 79,000 barrels per day in October 2017, bringing the total production output across the seven shale play regions in US to 6.1 million barrels per day. This would mark the tenth straight month in a row where US shale production is set to rise.
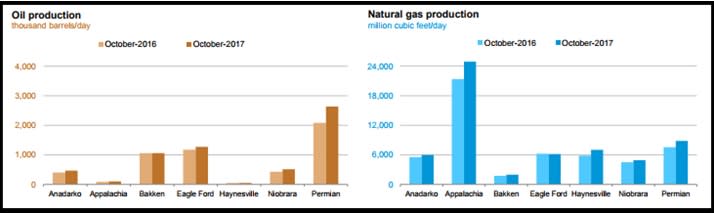
Source: EIA, Drilling Productivity Report
Seasonality
Seasonality plays another crucial role in oil prices as well, although a smaller one compared to other broader macro-factors. As the summer comes to an end, the US is going into fall and winter seasons.
Historically, crude oil prices tend to rise in summer due to the peak driving season which culminated a rise in gasoline demand (largest consumed component of refined oil). Conversely, come fall and winter, crude oil prices can turn sluggish.
In a seasonal study on oil prices, it was revealed that oil prices tend to peak out around September to October. Subsequently, oil prices tend to fall before it bottoms out in December. That said, oil prices could be supported, in the event where severe cold weather conditions precipitate higher-than-expected demand for heating oil and natural gas.
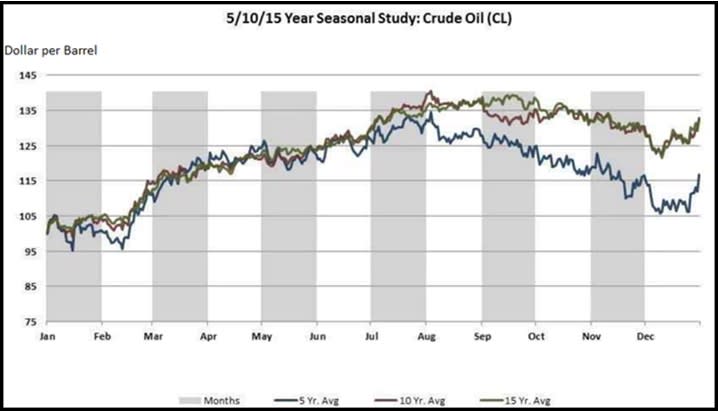
Source: David Stendahl
Other Factors
There are also other factors at play, for instance, OPEC has an estimated surplus capacity of about 2.1 million barrels per day. If any member chooses to “cheat” by not adhering to their production quotas, the crude oil could flood the market once again.
In the meantime, China has been propping oil prices as the rising superpower builds up its strategic oil reserve. Although undisclosed, Orbital Insight, a Silicon Valley tech company, speculated that the Chinese may have stored up as much as 600 million barrels of crude in May 2017. In the same month, China was the top oil importer, importing almost 8.8 million barrels of crude per day. As such, a slowdown in the rate of crude imports from China would cause significant adverse impact to the oil market.
Conclusion
Despite the uncertainties, there are still signs that the global oil market is stabilising as supply-demand dynamics are clearly much tighter than in 2015.
The current forces at play seem to point to some minor downward pressures on oil prices. Barring any unanticipated shocks though, WTI oil price should trade within the range of US$50 per barrel. Investors looking to bet on oil and gas stocks should pay attention to the developments and data of the abovementioned factors.

