
USD/JPY Forex Technical Analysis – 104.807 Potential Trigger Point for Acceleration to Downside
The Dollar/Yen is trading sharply lower on Wednesday as traders grow more optimistic that a U.S. fiscal stimulus deal will be reached within days and that money may be in the hands of U.S. citizens before the November 3 presidential election. The news is dampening the appeal of the U.S. Dollar as a safe-haven asset.
At 08:31 GMT, the USD/JPY is trading 104.961, down 0.551 or -0.52%.
Although negotiations have been going on for months, they received a jolt overnight after U.S. President Trump boosted hopes for a large fiscal stimulus package, prompting a wave of market optimism that saw traders ramp up their bets on riskier currencies.
Lawmakers in Washington have been negotiating intermittently since August, with Democrats arguing for a bigger package to help manage the economic fallout from coronavirus.
Trump raised hopes for a breakthrough on Tuesday by saying he was willing to accept a large aid bill, despite opposition from his own Republican party. The comments sparked some risk-on moves in currency markets.
Daily Swing Chart Technical Analysis
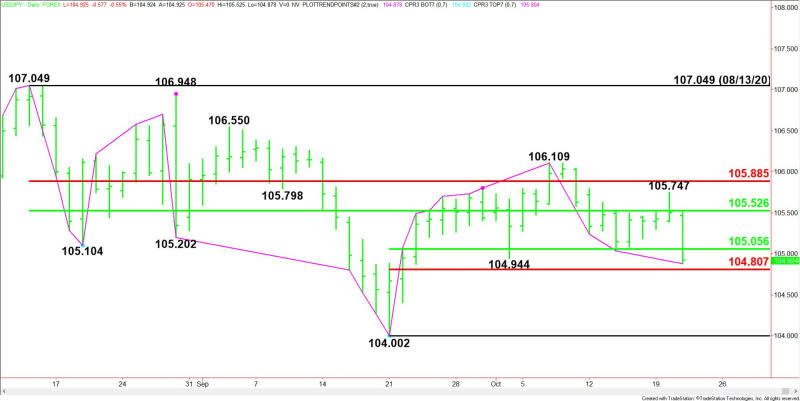
The main trend is down according to the daily swing chart. The next potential downside target is the September 21 main bottom at 104.002. The new main top is 106.109. A trade through this level will change the main trend to up.
The minor trend is also down. This was reaffirmed when sellers took out the October 2 main bottom at 104.944. A trade through 105.747 will change the minor trend to up. This will also shift momentum to the upside.
The short-term range is 107.049 to 104.002. Its retracement zone at 105.526 to 105.885 is resistance. This zone is also controlling the near-term direction of the USD/JPY.
The minor range is 104.002 to 106.109. Its retracement zone at 105.056 to 104.807 is the next downside target zone. This zone is currently being tested. We could see a technical bounce on the first test of this zone, but if it fails then look for an acceleration to the downside.
Daily Swing Chart Technical Analysis
The direction of the USD/JPY the rest of the session on Wednesday is likely to be determined by trader reaction to the minor retracement zone at 105.056 to 104.807.
Bullish Scenario
A sustained move over 105.056 will indicate the return of buyers. This could trigger the start of a short-covering rally. The main upside target of this move will be 105.526.
Bearish Scenario
A sustained move under 104.807 will signal the selling pressure is getting stronger. This could trigger an acceleration to the downside with the next major downside target coming in at 104.002.
For a look at all of today’s economic events, check out our economic calendar.
This article was originally posted on FX Empire

