
General election records and historical benchmarks
Here are some of the key electoral statistics from modern political history, including the most seats won, the biggest majorities achieved, and the highest ever shares of the vote.
All figures have been compiled by the PA news agency using data from the House of Commons Library.
– Largest majorities
The record for the largest majority won by a single party at a general election since 1900 is 210, set in 1924 by the Conservatives.
The election of 1900 was the first of its kind to be contested by the recently-formed Labour Party, as well as the long-established Conservative and Liberal parties, and as such can be seen as the first general election of the modern political era.
Labour’s largest majority to date is 178, in 1997 – the election that saw Tony Blair become prime minister.
Even larger majorities have been won by coalitions of parties.
A three-party National government, made up mostly of Conservatives along with small portions of the Labour and Liberal parties, won a majority of 242 at the 1935 election.
Four years earlier in 1931, the same National government won a majority of 492: the biggest ever parliamentary majority at a general election in modern political history.

– Most seats won by a single party
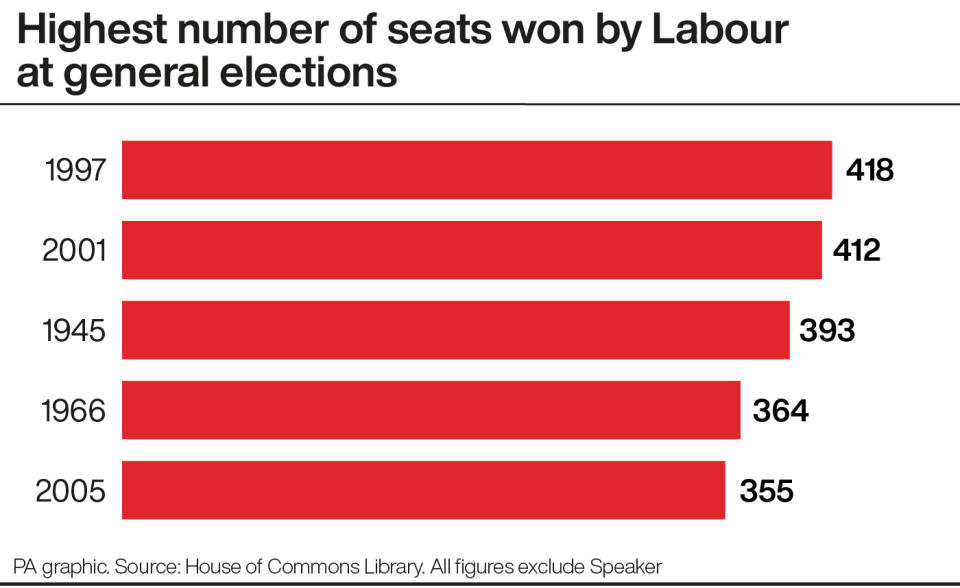
The highest number of seats won by a single party at an election since 1900 is 418, by Labour in 1997.
The second highest number is 412, won by Labour in 2001 and also by the Conservatives in 1924.
– Fewest seats won by Conservatives and Labour
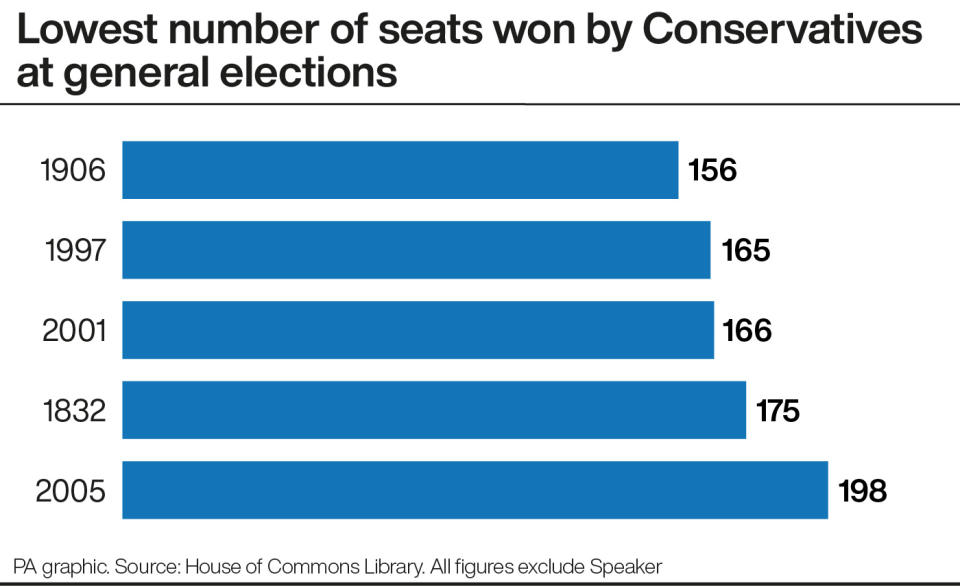
The fewest seats won by the Conservatives at any general election since the party was formally established in the 1830s is 156 in 1906, followed by 165 in 1997.
The Labour Party was founded in 1900 and won two seats in the general election of that year, followed by 29 at the next election in 1906.
Since 1945, the number of seats won by Labour has never dropped below 200.
– Best and worst performance by the Liberal Party or Liberal Democrats
The last time the Liberals won an overall majority in the House of Commons was in 1906, when the party won 400 MPs.
The 1923 general election was the last time the Liberals won more than 100 seats, with 158 MPs.
Since 1945, the party’s best performance at a general election – either as the Liberals or as the Liberal Democrats – came in 2005, when it secured 62 MPs.

– Most votes cast for winning party
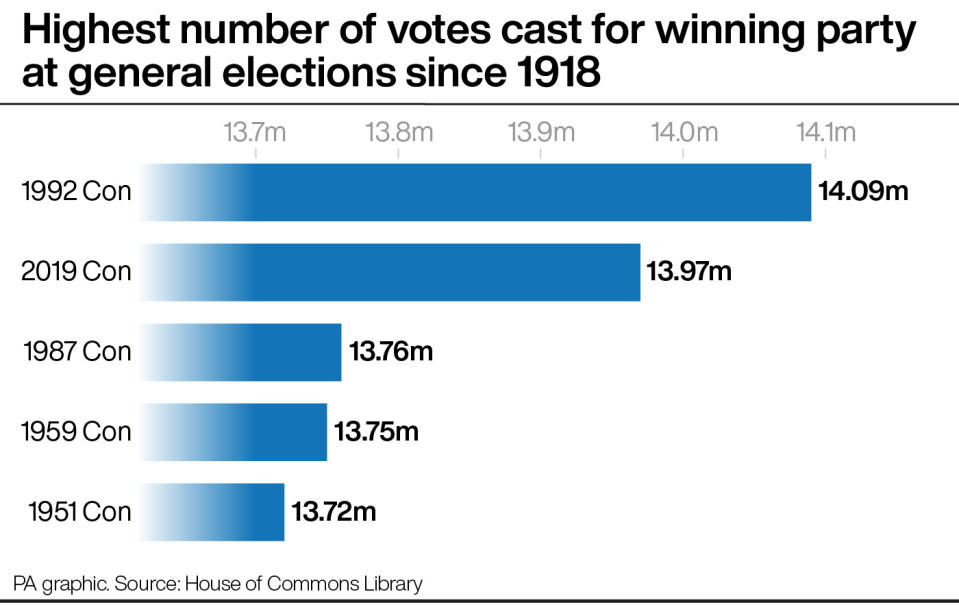
The record for the most number of votes cast for a winning party at a general election is 14.09 million, which were cast for the Conservatives in 1992.
This is just ahead of the 13.97 million votes for the Conservatives when they won the 2019 election.
The highest number of votes cast for Labour at an election which the party won is 13.52 million in 1997.
But the highest number of votes ever cast for Labour at an election was in 1951, when the party received 13.95 million votes but ended up with fewer seats than the Conservatives, despite the Tories winning 13.72 million votes.
– Fewest votes cast for winning party
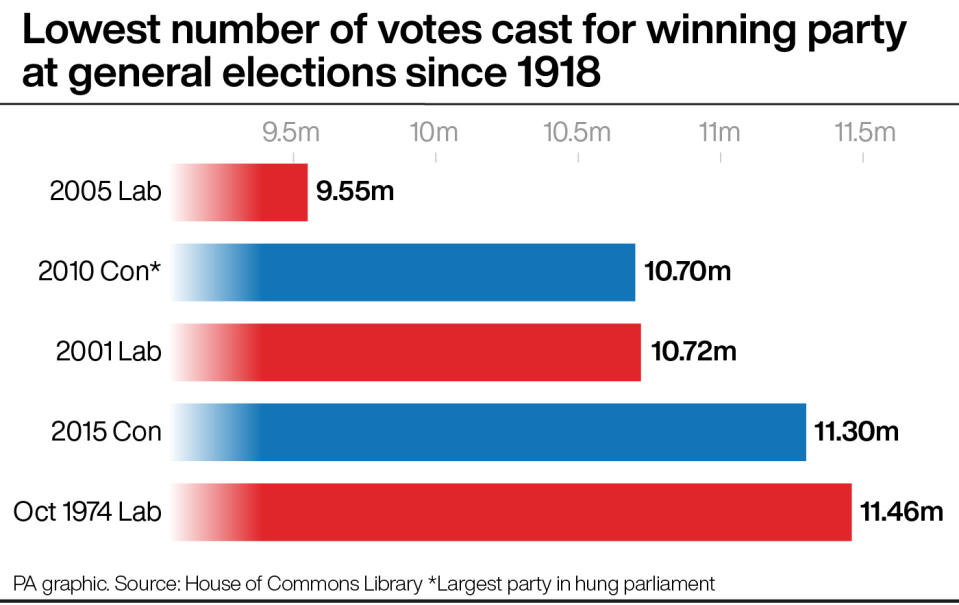
The fewest votes cast for a winning party at a general election is 9.55 million, received by Labour in 2005.
The Conservatives received 10.70 million votes in 2010, when the party ended up short of an overall majority but went on to form a coalition government with the Liberal Democrats.
The lowest number of votes received by the Conservatives at an election where they won a majority was 11.30 million in 2015.
– Biggest national swing
National swing is a way of showing the extent of change in voter support for a political party from one election to the next.
It is most commonly used to describe the change in the overall share of the vote of the two major parties, Conservatives and Labour.
At the 2019 general election, the Tories won 43.6% of the vote, up 1.3 percentage points from 42.3% in 2017, while Labour won 32.1%, down 7.9 points from 40.0% in 2017.
This translates into an average national swing from Labour to Conservative of 4.5 percentage points – the equivalent of nearly five in 100 people who voted Labour in 2017 switching to the Tories in 2019.
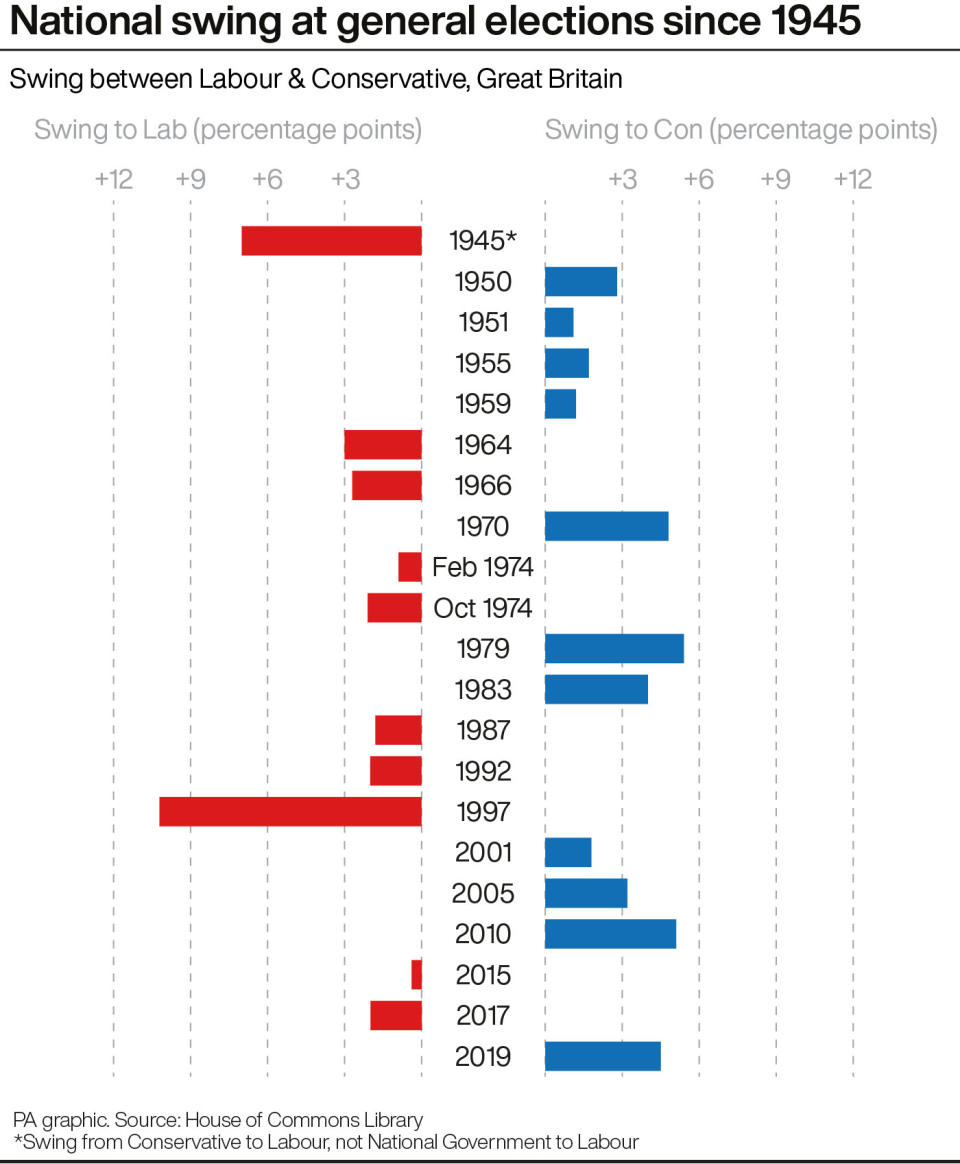
The biggest swing between the two major parties since the Second World War took place in 1997, when there was a swing from Conservative to Labour of 10.2 percentage points.
The largest swing from Labour to Conservative since the war was 5.4 percentage points, in 1979.
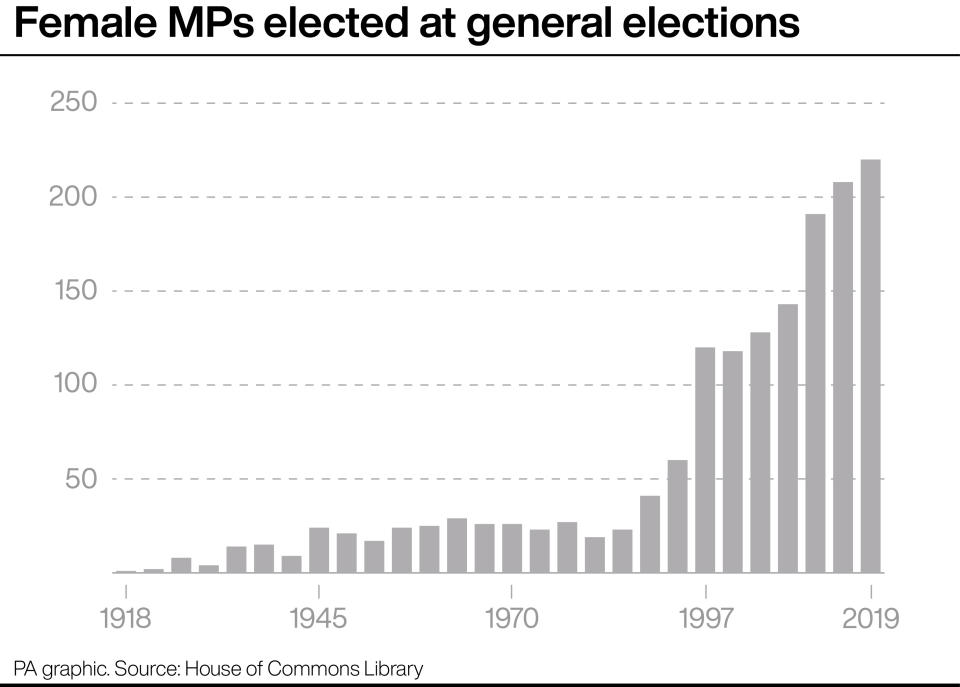
– Female MPs
A record 220 female MPs were elected at the 2019 general election, up from 208 in 2017.
The number of women MPs has risen at each of the past five elections.
The 1997 election was the first time the number of female MPs passed 100, with 120 elected, double the 60 in 1992.
– Largest and smallest shares of the vote
The highest share of the vote won by the Conservatives at a general election since 1918 is 49.7% in 1955.
The lowest is 30.7% in 1997.
The highest vote share won by Labour is 48.8% in 1951 and the lowest is 20.8% in 1918.
Labour’s lowest vote share since the Second World War is 27.6% in 1983.

The Liberals scored their highest vote share since 1918 in 1923 with 29.7%.
As the Liberal Democrats, the party’s highest share came in 2010, with 23.0%.
The combined vote share of the SNP and Plaid Cymru peaked at 5.3% in 2010.
The biggest share of the vote taken by other parties – not including the SNP and Plaid Cymru – is 19.5% in 2015.

