
‘Property prices at a turning point’
By Mr Propwise
From the URA's recent release of the 4Q2011 private residential property index, property price increases in Singapore have almost screeched to a halt. Prices were up just 0.2 per cent in 4Q2011 on a quarter-on-quarter basis and 5.9 per cent on a year-on-year basis.
At the current levels the price index is 16.2 per cent above the previous 2Q2008 peak, and 13.7 per cent above the previous all time high in 2Q1996.
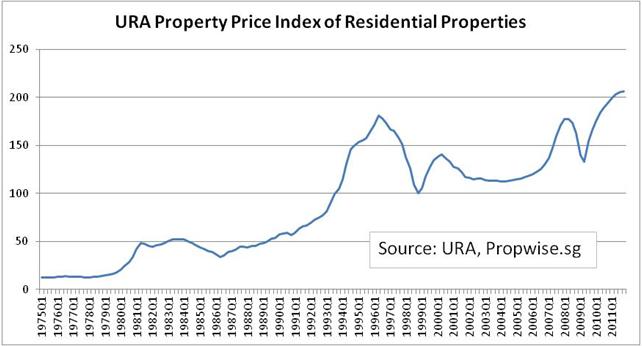
Figure 1 — URA Property Price Index
What is interesting to note is that the rate of growth of the PPI has been slowing for nine quarters, i.e. property price growth has been decelerating continuously, and is already close to zero. This is likely due to concern over the slowing economy, worrying global economic situation especially with the troubles in Europe and weak growth in the US, combined with the dampening effect of multiple rounds of government measures.

Figure 2 — Change in Property Price Index
I believe that residential property prices in Singapore are at a turning point and we are likely to see a quarter-on-quarter decline in the next 1Q2012 Property Price Index disclosure. Some analysts have estimated that prices were already down on a month-on-month basis in December 2011.
The uncertainty is whether we will see a sharp decline as during the 1997-1998 Asian Crisis and 2008-2009 Financial Crisis, or whether it will be a more gradual decline as we saw during the 2000-2004 Post-Dotcom Bubble and SARs era.
Can low interest rates prop up property prices?
However some believe that the abundant global liquidity situation could blunt or even reverse the decline in Singapore property prices. Led by the European Central Bank and Fed, governments around the world have been easing monetary policy and keeping interest rates low to prevent another crisis triggered by too much debt.

Figure 3 — Straits Times Index
We've already seen a New Year rally in the Straits Times Index, and if you believe that the stock market is a leading indicator for the property market, then we could see property prices supported in the coming quarters.
Anecdotally, mass market launches are still going strong and local investors' appetite for property is still robust even as the Additional Buyer's Stamp Duty has kept most of the foreigners away. For example, the recent launch of Parc Rosewood (by Fragrance Group and World Class Land) in Woodlands saw 165 of the 236 launched units sold at the $925-998 psf price range, 8-10 per cent lower than initially guided. This followed the strong take up of Watertown in Punggol.
But don't forget that this decelerating price growth trend preceded the property bear markets that began in 3Q2000 and 3Q2008 (but not the one in 3Q1996). So regardless of whether you are more a "technical" or "fundamental" investor (or both), it pays to be cautious in this market.
Supply in the pipeline is at a record high
Supply, at 77,089 uncompleted private residential units from projects in the pipeline, is at an all-time high since the URA started recording this data in 1999. At the same time volumes are falling — 4Q2011 sales of 3,603 new units (down 15% quarter-on-quarter) and 2,962 units (down 24% quarter-on-quarter) are both significant decreases.
Of this record supply, 39,184 units remain unsold as at 4Q2011 — this could present an overhang on the market for many quarters to come.
We've also seen widespread declines or Cash Over Valuations in the HDB market, which is a foreshadowing of a weaker private property market.
How much could the market fall?
I did a study of the previous three property market corrections and found that the PPI corrected in the range of 19.9 per cent to 44.9 per cent and that the correction lasted from 4 to 15 quarters:
2Q1996 Peak to 4Q2008 Trough — 44.9% decline over 10 quarters
2Q2000 Peak to 1Q2004 Trough — 19.9% decline over 15 quarters
2Q2008 Peak to 2Q2009 Trough — 24.9% decline over 4 quarters
If history is anything to go by, what this means is that the correction could be longer and stronger than what most people are expecting. However, I believe that we will only see similar levels of price declines if there is an external crisis to cause a sense of panic, which we had in each of the previous three declines (e.g. Asian Crisis, Dotcom Bubble, Global Financial Crisis).
Mr. Propwise is founder of www.Propwise.sg, a Singapore property blog dedicated to helping you understand the real estate market and make better decisions. Click here to get your free Property Beginner's and Buyer's Guide.
Related Articles
Where Will the Singapore Property Market Go in the Next Few Months? (at Propwise.sg)
Worrying Trends in the Singapore Property Market (at Propwise.sg)
Property Outlook for the Next Few Months — An Update (at Propwise.sg)

