
General Election top target seats, by party
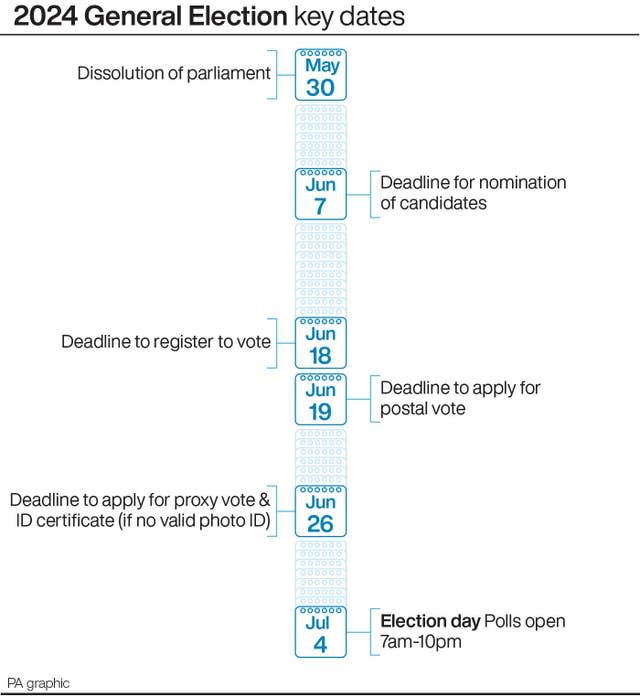
Here is a list of the top target seats for the main political parties at the General Election on July 4.
The election is being held using new constituency boundaries, which means the results cannot be compared directly with what happened at the last general election in 2019.
To measure how well the parties do at the election, and to determine which seats they need to win to form a government, a set of notional results for the 2019 election has been calculated to show what would have happened if that contest had taken place using the new boundaries.
These notional results have been compiled by Professor Colin Rallings and Professor Michael Thrasher of the University of Plymouth, on behalf of the PA news agency, the BBC, ITN and Sky News.
The lists of target seats are based on the size of the swing needed to gain the seat based on the notional outcome in 2019.
The top 100 targets have been listed for Labour and the Conservatives, the top 50 for the Liberal Democrats, and the top 10 for other parties (top nine for the SNP, as they can only make a maximum of nine gains).

The lists are ranked according to the size of the swing to gain, starting with the smallest.
The name of the constituency is followed in brackets by the notional 2019 winner of the seat, then by the size of the swing needed to gain, in percentage points.
Where appropriate, the swing takes account of the need to overtake the second placed party.
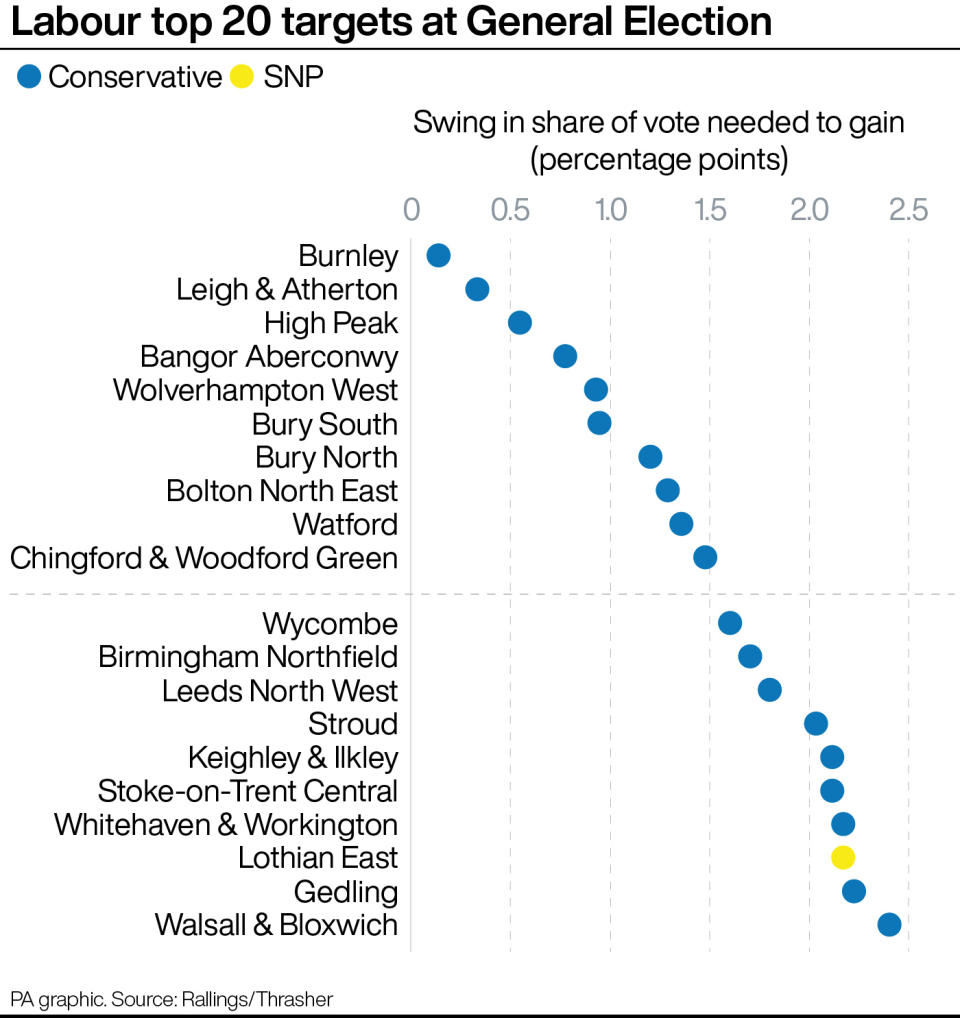
– Labour targets
1 Burnley (Con) 0.13 percentage points
2 Leigh & Atherton (Con) 0.33
3 High Peak (Con) 0.54
4 Bangor Aberconwy (Con) 0.77
5 Wolverhampton West (Con) 0.92
6 Bury South (Con) 0.94
7 Bury North (Con) 1.20
8 Bolton North East (Con) 1.28
9 Watford (Con) 1.35
10 Chingford & Woodford Green (Con) 1.47
11 Wycombe (Con) 1.59
12 Birmingham Northfield (Con) 1.69
13 Leeds North West (Con) 1.80
14 Stroud (Con) 2.03
15 Keighley & Ilkley (Con) 2.11
16 Stoke-on-Trent Central (Con) 2.11
17 Whitehaven & Workington (Con) 2.17
18 Lothian East (SNP) 2.17
19 Gedling (Con) 2.22
20 Walsall & Bloxwich (Con) 2.40
21 Peterborough (Con) 2.47
22 Vale of Glamorgan (Con) 2.57
23 West Bromwich (Con) 2.60
24 Cheshire Mid (Con) 2.66
25 Wakefield & Rothwell (Con) 2.67
26 Ynys Mon (Con) 2.69
27 Derby North (Con) 2.70
28 Bridgend (Con) 2.73
29 Clwyd North (Con) 2.76
30 Lancaster & Wyre (Con) 3.05
31 Hastings & Rye (Con) 3.36
32 Eltham & Chislehurst (Con) 3.37
33 Cowdenbeath & Kirkcaldy (SNP) 3.41
34 Lincoln (Con) 3.47
35 Hyndburn (Con) 3.48
36 Broxtowe (Con) 3.58
37 Chipping Barnet (Con) 3.60
38 Northampton North (Con) 3.85
39 Newton Aycliffe & Spennymoor (Con) 3.93
40 Hendon (Con) 4.01
41 Truro & Falmouth (Con) 4.04
42 Wrexham (Con) 4.18
43 Hull West & Haltemprice (Con) 4.35
44 Blackpool South (Con) 4.36
45 Calder Valley (Con) 4.52
46 Milton Keynes Central (Con) 4.70
47 Southampton Itchen (Con) 4.74
48 Clwyd East (Con) 5.00
49 Glasgow North East (SNP) 5.01
50 Darlington (Con) 5.36
51 Redcar (Con) 5.45
52 Ipswich (Con) 5.53
53 Coatbridge & Bellshill (SNP) 5.54
54 Altrincham & Sale West (Con) 5.61
55 Swindon South (Con) 5.70
56 Cities of London & Westminster (Con) 5.73
57 Airdrie & Shotts (SNP) 5.74
58 Bolsover (Con) 5.77
59 Shipley (Con) 5.78
60 Crewe & Nantwich (Con) 5.79
61 Loughborough (Con) 5.90
62 Midlothian (SNP) 5.92
63 Rutherglen (SNP) 5.97
64 Tipton & Wednesbury (Con) 6.14
65 Rushcliffe (Con) 6.18
66 Norwich North (Con) 6.31
67 Spen Valley (Con) 6.42
68 Glasgow South West (SNP) 6.43
69 Milton Keynes North (Con) 6.55
70 Worcester (Con) 6.64
71 Glasgow North (SNP) 6.72
72 Rother Valley (Con) 6.74
73 Southport (Con) 6.80
74 Ashfield (Con) 6.81
75 Shrewsbury (Con) 6.96
76 Worthing East & Shoreham (Con) 7.03
77 Caerfyrddin (Con) 7.04
78 Penistone & Stocksbridge (Con) 7.28
79 Barrow & Furness (Con) 7.43
80 Ceredigion Preseli (Plaid Cymru) 7.49
81 Colne Valley (Con) 7.50
82 Filton & Bradley Stoke (Con) 7.61
83 Glasgow East (SNP) 7.62
84 Uxbridge & South Ruislip (Con) 7.82
85 Pembrokeshire Mid & South (Con) 7.84
86 Thanet East (Con) 7.91
87 Corby & East Northamptonshire (Con) 8.05
88 Leeds South West & Morley (Con) 8.16
89 Hamilton & Clyde Valley (SNP) 8.18
90 Bishop Auckland (Con) 8.19
91 Chelsea & Fulham (Con) 8.21
92 Crawley (Con) 8.38
93 Na h-Eileanan an Iar (SNP) 8.42
94 Harrow East (Con) 8.59
95 South Ribble (Con) 8.65
96 Newcastle-under-Lyme (Con) 8.73
97 Bournemouth East (Con) 8.94
98 Stevenage (Con) 8.98
99 Motherwell, Wishaw & Carluke (SNP) 9.23
100 Glasgow South (SNP) 9.42
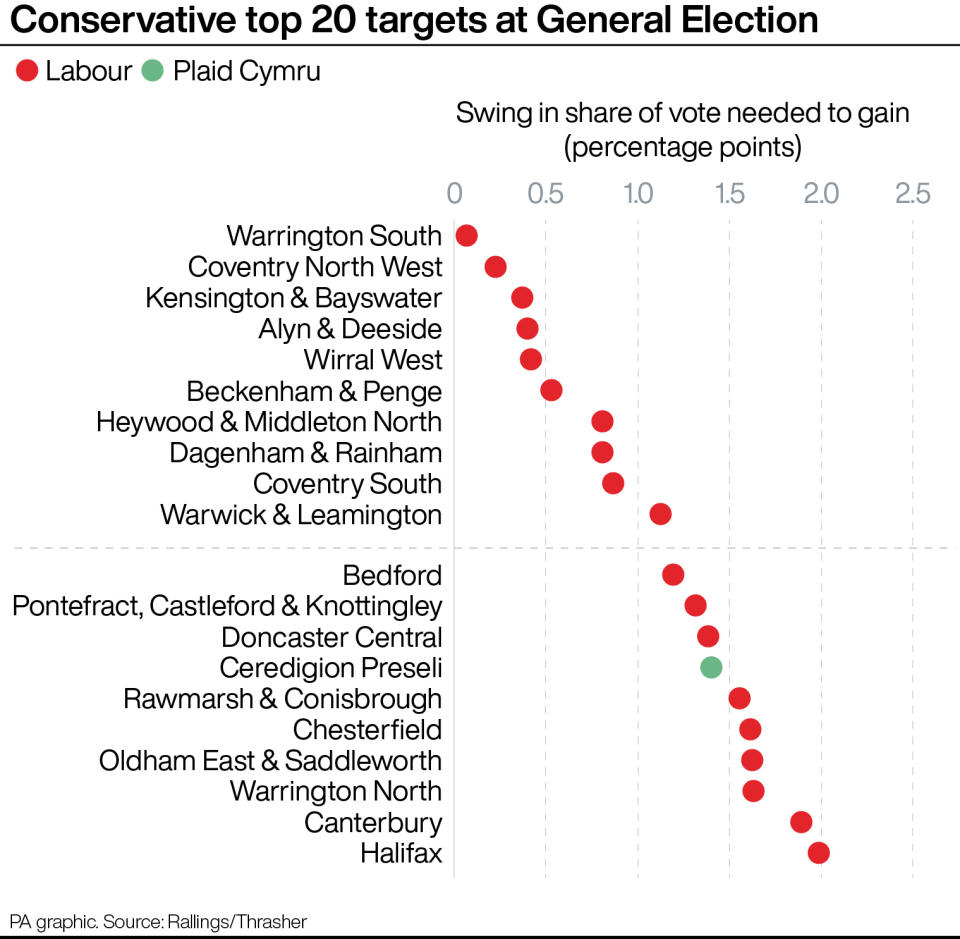
– Conservative targets
1 Warrington South (Lab) 0.06 percentage points
2 Coventry North West (Lab) 0.22
3 Kensington & Bayswater (Lab) 0.36
4 Alyn & Deeside (Lab) 0.39
5 Wirral West (Lab) 0.41
6 Beckenham & Penge (Lab) 0.52
7 Heywood & Middleton North (Lab) 0.80
8 Dagenham & Rainham (Lab) 0.80
9 Coventry South (Lab) 0.86
10 Warwick & Leamington (Lab) 1.12
11 Bedford (Lab) 1.19
12 Pontefract, Castleford & Knottingley (Lab) 1.31
13 Doncaster Central (Lab) 1.38
14 Ceredigion Preseli (Plaid Cymru) 1.40
15 Rawmarsh & Conisbrough (Lab) 1.55
16 Chesterfield (Lab) 1.61
17 Oldham East & Saddleworth (Lab) 1.62
18 Warrington North (Lab) 1.63
19 Canterbury (Lab) 1.89
20 Halifax (Lab) 1.99
21 Newport West & Islwyn (Lab) 2.06
22 Perth & Kinross-shire (SNP) 2.09
23 Cramlington & Killingworth (Lab) 2.24
24 Ayr, Carrick & Cumnock (SNP) 2.50
25 Moray West, Nairn & Strathspey (SNP) 2.58
26 Doncaster North (Lab) 2.58
27 Nottingham North & Kimberley (Lab) 2.89
28 Gower (Lab) 2.93
29 Leeds East (Lab) 3.06
30 Leeds West & Pudsey (Lab) 3.09
31 Wolverhampton South East (Lab) 3.10
32 Tynemouth (Lab) 3.26
33 Bradford South (Lab) 3.34
34 Croydon East (Lab) 3.37
35 Sunderland Central (Lab) 3.41
36 Stalybridge & Hyde (Lab) 3.48
37 Lothian East (SNP) 3.66
38 Hull East (Lab) 3.67
39 Houghton & Sunderland South (Lab) 3.73
40 Rotherham (Lab) 3.79
41 Putney (Lab) 3.98
42 Birmingham Erdington (Lab) 3.98
43 Worsley & Eccles (Lab) 4.00
44 Normanton & Hemsworth (Lab) 4.06
45 Llanelli (Lab) 4.32
46 Hartlepool (Lab) 4.38
47 Durham, City of (Lab) 4.54
48 Blaydon & Consett (Lab) 4.56
49 Stockton North (Lab) 4.61
50 Durham North (Lab) 4.63
51 Washington & Gateshead South (Lab) 4.69
52 Torfaen (Lab) 4.72
53 Argyll, Bute & South Lochaber (SNP) 4.83
54 Renfrewshire East (SNP) 4.90
55 Plymouth Sutton & Devonport (Lab) 5.20
56 Angus & Perthshire Glens (SNP) 5.31
57 St Albans (Lib Dems) 5.34
58 Aberdeen South (SNP) 5.45
59 Battersea (Lab) 5.49
60 Makerfield (Lab) 5.49
61 Sheffield South East (Lab) 5.56
62 Bristol North East (Lab) 5.59
63 Newport East (Lab) 5.64
64 Portsmouth South (Lab) 5.65
65 Ashton-under-Lyne (Lab) 5.67
66 Ayrshire Central (SNP) 5.70
67 Chester North & Neston (Lab) 5.93
68 Runcorn & Helsby (Lab) 5.97
69 Bristol North West (Lab) 6.19
70 Leicester East (Lab) 6.22
71 Newcastle upon Tyne North (Lab) 6.30
72 Leicester West (Lab) 6.32
73 Richmond Park (Lib Dems) 6.54
74 Hull North & Cottingham (Lab) 6.59
75 Luton South & South Bedfordshire (Lab) 6.73
76 Southampton Test (Lab) 6.90
77 Cardiff North (Lab) 6.93
78 Gateshead Central & Whickham (Lab) 7.03
79 Derby South (Lab) 7.09
80 Blyth & Ashington (Lab) 7.12
81 Cowdenbeath & Kirkcaldy (SNP) 7.25
82 Barnsley North (Lab) 7.28
83 Stirling & Strathallan (SNP) 7.40
84 Sheffield Hallam (Lab) 7.43
85 Wigan (Lab) 7.47
86 Huddersfield (Lab) 7.54
87 Caerphilly (Lab) 7.66
88 Lancashire West (Lab) 7.91
89 Feltham & Heston (Lab) 7.97
90 Reading Central (Lab) 8.10
91 Brighton Kemptown & Peacehaven (Lab) 8.38
92 Birmingham Edgbaston (Lab) 8.43
93 Coventry East (Lab) 8.54
94 Enfield North (Lab) 8.71
95 Ilford North (Lab) 8.72
96 Ayrshire North & Arran (SNP) 8.85
97 Hamilton & Clyde Valley (SNP) 8.99
98 Oxford West & Abingdon (Lib Dems) 9.05
99 Sefton Central (Lab) 9.12
100 South Shields (Lab) 9.13
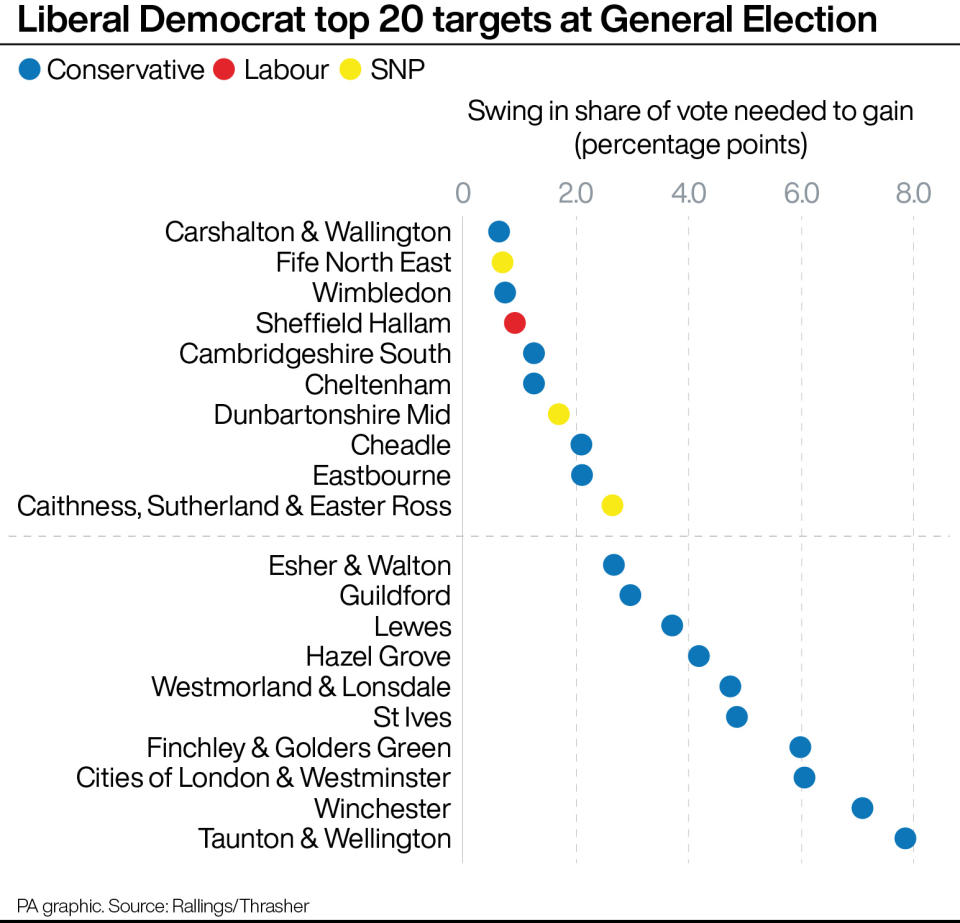
– Liberal Democrat targets
1 Carshalton & Wallington (Con) 0.64 percentage points
2 Fife North East (SNP) 0.70
3 Wimbledon (Con) 0.74
4 Sheffield Hallam (Lab) 0.92
5 Cambridgeshire South (Con) 1.25
6 Cheltenham (Con) 1.25
7 Dunbartonshire Mid (SNP) 1.70
8 Cheadle (Con) 2.09
9 Eastbourne (Con) 2.11
10 Caithness, Sutherland & Easter Ross (SNP) 2.64
11 Esher & Walton (Con) 2.68
12 Guildford (Con) 2.96
13 Lewes (Con) 3.71
14 Hazel Grove (Con) 4.18
15 Westmorland & Lonsdale (Con) 4.74
16 St Ives (Con) 4.85
17 Finchley & Golders Green (Con) 5.98
18 Cities of London & Westminster (Con) 6.05
19 Winchester (Con) 7.08
20 Taunton & Wellington (Con) 7.84
21 Harrogate & Knaresborough (Con) 7.91
22 Cambridge (Lab) 8.14
23 Sutton & Cheam (Con) 8.27
24 Woking (Con) 8.60
25 Brecon, Radnor & Cwm Tawe (Con) 8.70
26 Eastleigh (Con) 8.72
27 Didcot & Wantage (Con) 9.22
28 Bermondsey & Old Southwark (Lab) 9.28
29 Dorking & Horley (Con) 9.52
30 Godalming & Ash (Con) 9.63
31 Dorset West (Con) 10.71
32 Chelsea & Fulham (Con) 10.82
33 Henley & Thame (Con) 11.05
34 Newbury (Con) 11.24
35 Wokingham (Con) 11.59
36 Hitchin (Con) 11.67
37 Hampstead & Highgate (Lab) 11.68
38 St Neots & Mid Cambridgeshire (Con) 12.24
39 Ely & East Cambridgeshire (Con) 12.35
40 Devon South (Con) 12.66
41 Wells & Mendip Hills (Con) 12.66
42 Sussex Mid (Con) 12.90
43 Frome & East Somerset (Con) 12.92
44 Thornbury & Yate (Con) 12.96
45 Chippenham (Con) 13.06
46 Farnham & Bordon (Con) 13.27
47 Devon North (Con) 13.33
48 Glastonbury & Somerton (Con) 13.33
49 Tunbridge Wells (Con) 13.40
50 Earley & Woodley (Con) 13.48
– Green targets
1 Bristol Central (Lab) 16.23 percentage points
2 Isle of Wight West (Con) 19.30
3 Edinburgh North & Leith (SNP) 20.26
4 Dunfermline & Dollar (SNP) 21.35
5 Frome & East Somerset (Con) 21.61
6 Isle of Wight East (Con) 21.70
7 Hampstead & Highgate (Lab) 21.99
8 Livingston (SNP) 22.34
9 Bathgate & Linlithgow (SNP) 22.46
10 East Kilbride & Strathaven (SNP) 22.48
– SNP targets
1 Aberdeenshire West & Kincardine (Con) 0.79 percentage points
2 Dumfries & Galloway (Con) 1.48
3 Aberdeenshire North & Moray East (Con) 2.61
4 Edinburgh West (Lib Dems) 2.62
5 Gordon & Buchan (Con) 3.39
6 Dumfriesshire, Clydesdale & Tweeddale (Con) 4.26
7 Berwickshire, Roxburgh & Selkirk (Con) 4.84
8 Orkney & Shetland (Lib Dems) 5.41
9 Edinburgh South (Lab) 10.18
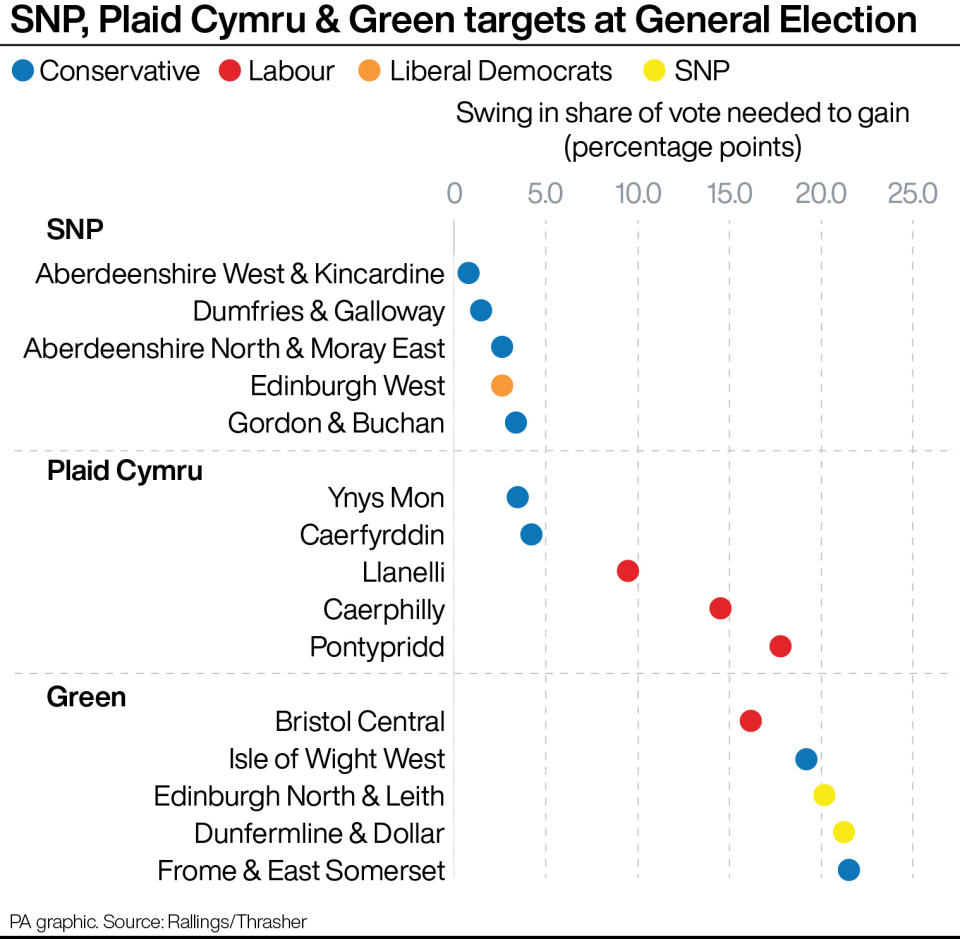
– Plaid Cymru targets
1 Ynys Mon (Con) 3.48 percentage points
2 Caerfyrddin (Con) 4.25
3 Llanelli (Lab) 9.53
4 Caerphilly (Lab) 14.59
5 Pontypridd (Lab) 17.87
6 Neath & Swansea East (Lab) 19.70
7 Cardiff West (Lab) 21.34
8 Merthyr Tydfil & Aberdare (Lab) 21.78
9 Rhondda & Ogmore (Lab) 21.93
10 Aberafan Maesteg (Lab) 21.97
– Reform UK targets
(Based on the notional 2019 performance of the Brexit Party, as Reform UK was then called)
1 Barnsley North (Lab) 4.50 percentage points
2 Hartlepool (Lab) 5.92
3 Barnsley South (Lab) 6.29
4 Doncaster North (Lab) 12.82
5 Easington (Lab) 14.31
6 South Shields (Lab) 14.70
7 Rotherham (Lab) 16.07
8 Normanton & Hemsworth (Lab) 16.19
9 Blaenau Gwent & Rhymney (Lab) 16.20
10 Caerphilly (Lab) 16.85

