

SI Research: 3 Net-net Stocks With Dividends
Net-net investing is a value-investing technique popularised by the father of value investing Benjamin Graham – the mentor to Warren Buffett. The approach values a company based on how much investors could receive immediately assuming that the company is liquidated, by taking current assets net of total liabilities without taking into consideration the worth of its long-term assets. In fact, it is not absurd to think that some investors might actually prefer that the company be liquidated so that its intrinsic value could be realised.
The irony is that if net-net stocks are indeed so undervalued, then why are they trading at such attractive prices? The problem with net-net stocks is that although they might be rich in terms of asset value, their profitability are often not that spectacular and hence lose favor amongst investors who are looking for growth. As such to make our selection more robust, we added an additional filter to pick net-net companies that consistently reward shareholders with dividends for their patience. In addition, these companies must at least be profitable for the last couple of years.
Haw Par Corporation
Haw Par Corporation’s (Haw Par) core business is in the promotion and distribution of its proprietary healthcare products in key Asian and European markets. Their trademark products include Tiger Balm Ointment and Medicated Plasters.
The group’s FY17 revenue rose 10.5 percent to $222.7 million on better performance from both healthcare and property segments driven by higher sales to most key markets and improved occupancy. However, weighed by escalating distribution and marketing expenses as well as general and administrative expenses, Haw Par reported a net profit of $125.5 million which merely inched up by 0.4 percent year-on-year. Over the last five years, revenue and net profit grew at a compounded annual growth rate (CAGR) of 12.1 percent and 3.8 percent respectively.
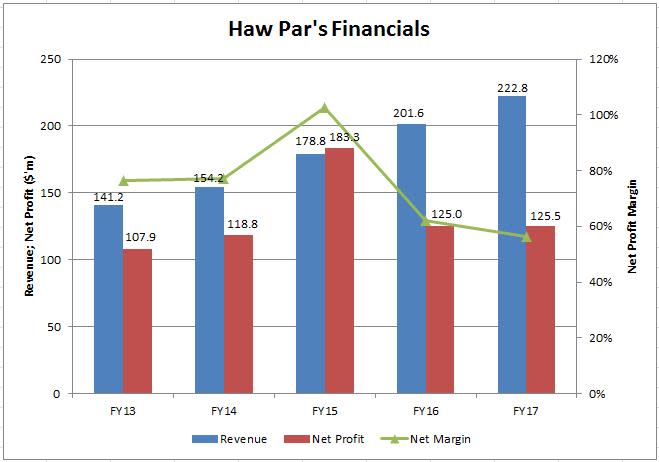
Source: Company Annual Report
While Haw Par’s bottom-line growth does not fit into the bill of a fast bloomer typical of having double-digit growth, what is mind-blowing is the group’s strength in its balance sheet. As at 31 December 2017, the group has cash balances of $401 million but only $45 million of borrowings, translating into a net cash position of $355.9 million. Moreover, with current assets of $970.2 million and total liabilities at $186.7 million, Haw Par no doubt qualified as a net-net stock with its adjusted net working capital (herein defined as current assets minus total liabilities) standing at $783.6 million. It is noteworthy that this has not even taken into account Haw Par’s non-current assets of $2.4 billion, which include $2.2 billion worth of financial assets and $212.9 million of investment properties. As Haw Par’s financial assets are quoted equity securities primarily constituted of United Overseas Bank, UOL Group and United Industrial Corporation, not only can their value be easily determined but they continue to provide Haw Par with a supplementary source of dividend income.
Trading at the market price of $13.40 as at 16 April 2018, it offers a 8.7 percent discount to Haw Par’s net asset value (NAV) of $14.68. In addition, Haw Par has been paying out a consistent dividend of $0.20 for the last five years if we were to exclude the special dividend of $0.15 in 2015. That would mean a dividend yield of 1.5 percent. Though not a very attractive yield, but it does look good coupled with the book value discount.
Wheelock Properties
Wheelock Properties (Wheelock) is in the business of property development and investments primarily in Singapore and China. The group’s FY17 revenue slid 30.7 percent to $533.7 million mainly due to lower sales in its development projects – The Panorama and Admore Three. However in the absence of fair value loss of $55.7 million on investment properties recorded last year, net profit almost doubled to $115.2 million. Over a five-year period, revenue and net profit grew at a CAGR of 46.1 percent and 30.3 percent respectively.

Source: Company Annual Report
With sales proceeds coming in from the development properties, Wheelock has accumulated $766.2 million of cash equivalents and zero debts as at 31 December 2017. The group made it into our list of net-net stocks with current assets of $1.2 billion and $222 million of total liabilities, which represented an adjusted net working capital of around $1 billion. This too has not taken into consideration the $2.1 billion worth of non-current assets which Wheelock possessed.
Approximately half of Wheelock’s non-current assets is accounted for by its portfolio of investment properties valued at $1.1 billion by independent professional valuers. These comprise Wheelock Place (a 16-storey office tower above a retail podium situated in the heart of Orchard Road shopping belt) as well as Scotts Square (a residential-cum-retail development situated at 6 Scotts Road). As at 31 December 2017, occupancy in these two investment properties remained high at around 95 percent and 98 percent respectively and will continue to contribute to the group’s recurring rental income.
Wheelock’s share price currently offers a 30.7 percent discount to its NAV of $2.61 by trading at $1.81 as at 16 April 2018. The group has been paying out a dividend of $0.06 per share consistently over the last ten years since 2007, which is equivalent to a yield of 3.3 percent based on its last market price. This reasonable yield definitely made Wheelock a much more appealing investment on top of the deep value it proposed.
Yeo Hiap Seng
Yeo Hiap Seng engages in the manufacturing, distribution and sales of food and beverage products, carrying some of its more popular brands including YEO’s, H-Two-O and Justea with presence in Singapore, Malaysia and Cambodia. In FY17, revenue declined by 16.9 percent to $340.7 million largely due general market weakness, competitive pricing and sales disruption in Cambodia. Nonetheless, because of a gain on disposal of investment in Super Group of $138.4 million, net profit surged multiple times to $153.7 million.
Battling in the challenging food and beverage sector marked by intense market competition and fluctuations in raw material prices, it is not surprising that Yeo Hiap Seng’s financial performances has been less than satisfactory. In the last five years, revenue shrank at a CAGR of negative 9.8 percent.
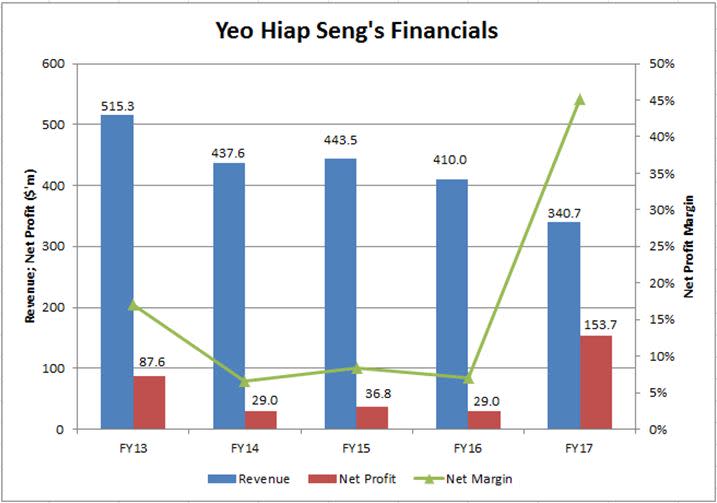
Source: Company Annual Reports
Apart from the mediocre top-line performance, Yeo Hiap Seng’s healthy balance sheet would warrant us to take another look at the company. With the proceeds from the divestment of Super Group, the group’s cash assets more than tripled to $294.8 million while not having any borrowings or debt securities. Furthermore, current assets at $426.6 million have already surpassed the total liabilities of $85.9 million making it a net-net counter with an adjusted net working capital of $340.6 million. In addition, Yeo Hiap Seng still owns $315.9 million worth of non-current assets majority of which is the group’s property, plant and equipment valued at $245.4 million.
Yeo Hiap Seng distributed a special dividend of $0.02 on top of the $0.02 final dividend in FY17. If we were to exclude special dividends in our consideration, the group’s payout of $0.02 every year since 2013 would indicate a yield of 1.8 percent based on the last market price of $1.13 as at 16 April 2018. Meanwhile, price-to-book ratio stood at exactly one times with Yeo Hiap Seng’s NAV of $1.13 as at 31 December 2017. Yet another example of a value proposition with consistent dividend payouts.

